Thursday, 31 January 2013

What is fertilizer and why do plants need it?

In order for a plant to grow and thrive, it needs a number of different chemical elements. The most important are:
  • Carbon, hydrogen and oxygen - Available from air and water and therefore in plentiful supply
  • Nitrogen, phosphorus, potassium (a.k.a. potash) - The three macronutrients and the three elements you find in most packaged fertilizers
  • Sulfur, calcium, and magnesium - Secondary nutrients
  • Boron, cobalt, copper, iron, manganese, molybdenum and zinc - Micronutrients
The most important of these (the ones that are needed in the largest quantity by a plant) are nitrogen, phosphorus and potassium. If you have read the articles How Cells Work and How Food Works, you have heard about things like amino acids, cell membranes and ATP. Nitrogen, phosphorus and potassium are important because they are necessary for these basic building blocks. For example:
  • Every amino acid contains nitrogen.
  • Every molecule making up every cell's membrane contains phosphorous (the membrane molecules are called phospholipids), and so does every molecule of ATP (the main energy source of all cells).
  • Potassium makes up 1 percent to 2 percent of the weight of any plant and, as an ion in cells, is essential to metabolism.
Without nitrogen, phosphorus and potassium, the plant simply cannot grow because it cannot make the pieces it needs. It's like a car factory running out of steel or a road crew running out of asphalt.
If any of the macronutrients are missing or hard to obtain from the soil, this will limit the growth rate for the plant. In nature, the nitrogen, phosphorous and potassium often come from the decay of plants that have died. In the case of nitrogen, the recycling of nitrogen from dead to living plants is often the only source of nitrogen in the soil.
To make plants grow faster, what you need to do is supply the elements that the plants need in readily available forms. That is the goal of fertilizer. Most fertilizers supply just nitrogen, phosphorus and potassium because the other chemicals are needed in much lower quantities and are generally available in most soils. Nitrogen, phosphorus and potassium availability is the big limit to growth.
The numbers on a bag of fertilizer tell you the percentages of available nitrogen, phosphorus and potassium found in the bag. So 12-8-10 fertilizer has 12-percent nitrogen, 8-percent phosphorous and 10-percent potassium. In a 100-pound bag, therefore, 12 pounds is nitrogen, 8 pounds is phosphorous and 10 pounds is potassium. The other 70 pounds is known as ballast and has no value to the plants.
So why don't people need fertilizer to grow? Because we get everything we need from the plants we eat or from the meat of animals that ate plants. Plants are factories that do all of the work to process the basic elements of life and make them available to us.

Timing Fertilizer Applications

Timing Fertilizer Applications

Pre plant Incorporation: The best time to improve soil fertility is before planting, because nutrients can be thoroughly mixed into the soil where the plant roots will be. Phosphorus is the most important element in this category, because it moves slowly. Lime or sulfur, if needed to correct pH levels, is most effective when incorporated the season before planting. This allows time for the chemical reactions that change pH to take place. Nitrogen can also be added before planting. Inorganic forms, however, are not recommended at this time, because they leach easily, and at high levels may injure the fine roots of newly-planted ornamentals. The best sources of nitrogen in organic forms are composted materials or fish emulsion.
Roots absorb nutrients most effficiently when they are actively growing in late winter/early spring or fall. The best time to apply fertilizer is about two weeks before these periods so that the nitrogen can move into the root zone in time to be available for plant use.

Application Methods

Five methods�liquid injection, drill hole or punch bar, surface application fertilizer stakes or spikes, foliar spraying, and tree-trunk injection or implants �are discussed here. Each serves a specific role depending on the site and plant health. Regardless of the method selected, the soil should be moist at the time of fertilizing to prevent fertilizer injury to the plant. Liquid Injection. Through liquid injection into the soil, fertilizer solutions are placed in the root zone. This is an excellent method for correcting nutrient deficiencies. Injection sites should be 2 to 3 feet apart, depending on pressure, and 6 to 9 inches deep. Fertilizing deeper than 9 inches may place the fertilizer below the absorbing roots, preventing plant use. When using this method in summer or during periods of drought, water should be added to dry soil.
Drill Hole or Punch Bar. A major advantage of the drill-hole system is the opening of heavy, compacted soils, which allows air/ moisture and fertilizer to move into the soil. The drill holes should be placed in concentric circles or in a grid system around the main stem beginning 3 to 4 feet from the main stem and extending beyond the drip line. Space the holes 2 feet apart and drill them 6 to 9 inches deep. The recommended rate of fertilizer for the area should be uniformly distributed among the holes and is based on the root-zone space under the tree (and not the trunk diameter). The holes can be filled either with organic materials such as peat moss or compost, or inorganic materials such as gravel, sand, or calcined clay.
Surface Application. Applying fertilizer to the ground surface is as effective as most other methods. It is best to apply the fertilizer and then water in slowly. It is okay to place fertilizer on top of mulch in landscape beds.
Fertilizer Stakes or Spikes. Fertilizer stakes or spikes that are driven into the soil contain satisfactory fertilizer materials. Unfortunately, the spacing of spikes is such that very little fertilizer comes in contact with the root system. One or two stakes per inch of trunk diameter do not represent adequate fertilizer distribution, because lateral fertilizer movement is limited in soil.
Foliar Spraying. Spraying liquid or water-soluble fertilizer on the foliage is best for correcting deficiencies of minor elements, especially of iron and manganese. This method should not be used as a means of providing all the macronutrients required by plants. To correct chlorosis, yellowing of plants caused by nutrient deficiency, several applications during a growing season may be necessary.
Tree-Trunk Injection or Implants. The infusion of liquid or implants of fertilizer is often the best method for correcting iron and manganese problems in landscape trees. This method is especially useful in areas of adverse soil pH, high moisture, or where other means of application are not practical. The wound caused by holes made in the trunk root flare will close within a growing season.

Signs of Nutrient Deficiency in plant

Element and Foliar symptoms
Nitrogen (N) General yellowish-green; moxe severe on older leaves. Stunted growth; small, fewer leaflets; early leaf drop. Dark green to blue-green, slightly smaller leaves. Veins, petioles, or lower surface may become reddish-purple, especially when young; death of lower needles in pmes.
Potassium (K) Partial chlorosis of most recently matured leaves in interveinal area beginning at tips, followed by necrosis. Older leaves may become brown and curl downward.
Calcium (Ca) Death of terminal buds, tip die- back, chlorosis of young leaves; leaves may become hard and stiff. Root injury is the first apparent sign.
Magnesium (Mg) Marginal chlorosis on older leaves followed by interveinal chlorosis. EIPS and margins may become brittle and curl upward.
Sulfur (S) Uniform chlorosis of new leaves; older leaves are usually not affected.
Iron (Fe) Interveinal chlorosis of young leaves (sharp distinction between green veins and yellow tissue between veins). Older basal leaves greener; exposed leaves blanched.
Manganese (Mn) Interveinal chlorosis of young leaves beginning at margins and progressing toward midribs; followed by necrotic spots.
Zinc (Zn) Young leaves may be yellow, small, deformed, or mottled with necrotic spots. There may be a tuft of leaves at shoot tips.
Boron (B) Terminal growth dies; later growth that develops has sparse foliage. Young leaves may be red, bronzed, or scorched. Leaves may be small, thick, distorted, or brittle.
Copper (Cu) Rosetting of terminal growth may die. Leaf symptoms not usually pronounced, but veins may be lighter than blades.
Molybdenum (Mo) Cupping of the older leaves; marginal chlorosis followed by interveinal chlorosis. Source: Pennsylvania Cooperative Extension

Wednesday, 30 January 2013

What is Vapor Absorption System

What is Vapor Absorption System

VAPOR ABSORPTION SYSTEM

The vapor absorption system differs from the compression system in a way that it uses heat energy instead of mechanical energy to make a change in the conditions necessary to complete the refrigeration cycle. The heat energy for this purpose may be obtained form a gas burner, kerosene oil lamp or electric heater. The system uses a minimum number of moving parts. The only moving part used smaller units are valves and controls bat larger units use circulating pumps and fans also. Due to the absence of moving parts such units are quiet in operation and may be used for both commercial and domestic installation.
The working of an absorption machine depends upon the use of two substances which have great affinity for each other and which can be easily separated by the application of heat. The principal combination euphoric acid water or ammonia and water the latter deign quite common are use.

SIMPLE ABSORPTION SYSTEM:

If the compressor in a vapor compression system were replaced with a generator is absorber assembly the result would be a simple absorption system.
In this case the low pressure refrigerant vapor coming from the evaporator is absorbed in the absorber by the weak solution. Of refrigerant water, absorption of ammonia lower the pressure in the absorber, which in turn draws more ammonia vapor from the evaporator some form of cooling arrangement usually water cooling, is employed in the absorber to remove the heat of solution evolved there. This is necessary to increase the absorption capacity of water because it is tick if refrigerant The pump draws strong solution from the absorbers builds up a pressure up to 10 kgf/cm square and forces the strong solution in the generator.
In the generator the strong solution of ammonia is heated by some external source such as gas or steam in the heating process the ammonia vapor driven our of the solution as a high pressure vapor leaving behind in the generator a weak solution. The weak solution flows back to the absorber through a restriction which maintains the pressure differential between the high and low sides of the system. From the generator the refrigerant vapor is conducted to the condenser where it is condensed. Then the high pressure liquid ammonia is passed through a throttle valve to the evaporator where it absorbs its latent heat thus procuring cold.

Practical Absorption System

The simple absorption system discussed above can function and provide refrigeration but its operating efficiency will be very low. In order to make it more refrigeration but its operating efficiency will be very low. In order to make it more practical it is fitted with a heat exchanger, an analyzer and a rectifier. These accessories which help to improve the performance and working f the plant are described below.
· Heat Exchanger: The location of the heat exchanger between the generator and absorbers is ideal. The strong solution pumped from the absorber to the generator must be heated; and the weak solution form the generator to the absorber must e cold. The heat exchanger between the two streams therefore reduces both the cost of heating the generator and the cost of cooling absorber.
· Analyzer: The analyzer is a direct contact heat exchanger consisting of series of tray mounted above the generator. Its function is to remove partly some of the unwanted water particle associated with ammonia vapor going to the condenser. The water vapor if allowed to enter to condenser may enter the expansion valve where they will freeze and choke the pipe line.
Rectifier: The final reduction of the percentage of water vapor occurs in the rectifier, water cooled heat exchanger which condenses water vapor and returns it to the generator. The net refrigerating effect of such a machine is the heat extracted in the evaporator. The total energy supplied for operating the machine is the sum of the work done by the liquid pump and the heat supplied in the generator.

Chiller: How Vapor Absorption Chiller Works?

The efficiency of worker and machine in engineering plant can be increased in controlled temperature conditions. To control the temperature of a space, air-conditioned machines are used. Depending up on the area to be cooled various types of conditioners are invented. These machines can work on different working principle. Here you will know some thing about vapor absorption technology.
What is mean by Vapor?
A vapor is a substance in the gas phase at a temperature lower than its critical temperature. This means that the vapor can be condensed to a liquid or to a solid by increasing its pressure, without reducing the temperature. The critical temperature of a substance is the temperature at and above which vapor of the substance cannot be liquefied, no matter how much pressure is applied. The critical pressure of a substance is the pressure required to liquefy a gas at its critical temperature.
The vapor pressure is the equilibrium pressure from a liquid or a solid at a specific temperature.
What is meaning of Absorption?
Absorption is a physical or chemical phenomenon or a process in which atoms, molecules, or ions enter some bulk phase – gas, liquid or solid material. Absorption is basically where something takes in another substance.
What is meaning by Chiller?
A chiller is a machine that removes heat from a liquid via a vapor-compression or absorption refrigeration cycle. Absorption chillers utilize water as the refrigerant and rely on the strong affinity between the water and a lithium bromide solution to achieve a refrigeration effect.
Decentralize chillers are usually small in size (cooling capacity), usually from 0.2 tons to 10 tons. Central chillers generally have capacities ranging from ten tons to hundreds or thousands of tons.
How single effect absorption chiller works?
The single effect absorption cycle uses water as the refrigerant and lithium bromide as the absorbent. It is the strong affinity that these two substances have for one another that makes the cycle work. The entire process occurs in almost a complete vacuum.
1. Solution Pump
A dilute lithium bromide solution is collected in the bottom of the absorber shell. From here, a hermetic solution pump moves the solution through a shell and tube heat exchanger for preheating.
2. Generator
After exiting the heat exchanger, the dilute solution moves into the upper shell. The solution surrounds a bundle of tubes which carries either steam or hot water. The steam or hot water transfers heat into the pool of dilute lithium bromide solution. The solution boils, sending refrigerant vapor upward into the condenser and leaving behind concentrated lithium bromide. The concentrated lithium bromide solution moves down to the heat exchanger, where it is cooled by the weak solution being pumped up to the generator.
3. Condenser 
The refrigerant vapor migrates through mist eliminators to the condenser tube bundle. The refrigerant vapor condenses on the tubes. The heat is removed by the cooling water which moves through the inside of the tubes. As the refrigerant condenses, it collects in a trough at the bottom of the condenser.
4. Evaporator
The refrigerant liquid moves from the condenser in the upper shell down to the evaporator in the lower shell and is sprayed over the evaporator tube bundle. Due to the extreme vacuum of the lower shell, the refrigerant liquid boils at approximately 39°F (3.9°C), creating the refrigerant effect. (This vacuum is created by hygroscopic action – the strong affinity lithium bromide has for water – in the Absorber directly below.)
5. Absorber 
As the refrigerant vapor migrates to the absorber from the evaporator, the strong lithium bromide solution from the generator is sprayed over the top of the absorber tube bundle. The strong lithium bromide solution actually pulls the refrigerant vapor into solution, creating the extreme vacuum in the evaporator. The absorption of the refrigerant vapor into the lithium bromide solution also generates heat which is removed by the cooling water. The now dilute lithium bromide solution collects in the bottom of the lower shell, where it flows down to the solution pump. The chilling cycle is now completed and the process begins once again.

10 Interesting Diabetes Facts

The diabetes facts below will give you much information related to one of the deadliest diseases in the world. Many people pass away because of this disease. The effort of the scientists to find the perfect cure is still developed from time to time. It seems that diabetes is powerful enough to take human life. In this post I will show you 10 interesting diabetes facts which can increase your knowledge about it.
1.India
The first point of diabetes facts tells you about India. Based on the current research, it is stated that more than 40 million Indian people are living with diabetes. This number will increase by 2025. The scientists predict that the disease may affect 70 million people in India. There is no need to wonder when some people call India as the diabetic capital of the planet.

Diabetes facts diabetes logo 10 Interesting Diabetes Facts
Diabetes facts: diabetes logo
2.silent epidemic
This disease is considered as silent epidemic. Based on the WHO data, the people living with diabetes worldwide come in the number of 246 people. It means that it affects 6 percent of adult people in the earth.
Diabetes facts diabetes medicine 10 Interesting Diabetes Facts
Diabetes facts: diabetes medicine
3.Diabetes type 2
Diabetes type 2 is more dangerous than diabetes type 1. More than 90 per cent of the people affected by diabetes type 2 are the middle aged people. The type 2 is called as maturity onset type. The type 1 usually is called as juvenile diabetes. It has affected the children under 15 years old.
Diabetes facts Diabetes type 2 10 Interesting Diabetes Facts
Diabetes facts: Diabetes type 2
4.Cost for diabetes treatment
The cash that you have to spend to treat diabetes is not a little. It is estimated that 215 up to 375 billion dollar is needed to pay the entire diabetes treatment bill. The developing countries are the worst victim of diabetes since they live in poor condition with low income to support the treatment.
Diabetes facts diabetes patient 10 Interesting Diabetes Facts
Diabetes facts: diabetes patient


5.Diabetes in Asia
The first point of diabetes facts tells you about diabetes in Asia. The growth of this disease in Asia is high. Compared to the white people, the rate of the diabetes for the Asian people is five times higher.
Diabetes facts diabetes test 10 Interesting Diabetes Facts
Diabetes facts: diabetes test
6.Kidney failure
Diabetes is a frightening disease. It can lead into some complication which make parts of your organ cannot function well. Based on the research, diabetes is the primary cause of kidney failure. Moreover, more than five million adults get blind because of this disease. You can also have some other acute diseases like stroke, heart disease and cataract.
Diabetes facts exercise 10 Interesting Diabetes Facts
Diabetes facts: exercise
7.Central obesity
What make the people experience diabetes? It is stated that obesity is the main cause. If your body looks like an apple, you should work hard to make it in shape unless you want to catch by diabetes.
Diabetes facts healthy cycle 10 Interesting Diabetes Facts
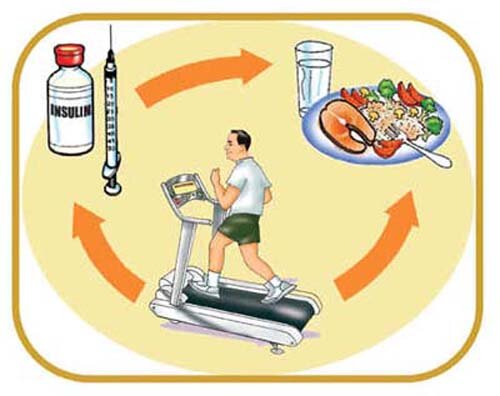
Diabetes facts: healthy cycle
8.Silent killer disease
Diabetes is considered as a silent killer disease. People who have diabetes sometimes do not feel anything about it since the symptoms are rarely occurred. Probably, you need to perform a complete test to know about it.
Diabetes facts healthy food1 10 Interesting Diabetes Facts
Diabetes facts: healthy food
9.Diabetes and death
The number of death caused by diabetes is so high. In a minute, it is reported that six people die because of this disease. In a year, more than 3.2 million people get killed because of this silent killer.
Diabetes facts insulin 10 Interesting Diabetes Facts
Diabetes facts: insulin
10.Primary cause
The primary cause of having diabetes is the sedentary life style. If you want to avoid this disease, you need to work out regularly. It can reduce the ratio for having diabetes up to 50 per cent. You need to exercise at least twice a week.
Diabetes facts type 1 diabetes 10 Interesting Diabetes Facts
Diabetes facts: type 1 diabetes

10 Interesting Alcohol Facts

We will talk about the alcohol facts since we are concerned much about the health.  For the last few years, there are thousands of people die because of drinking too much alcohol. Some of them are choking on their vomit. You need to think much about quitting alcohol if you like to have a great health.
1.Dehydration
Let’s begin the discussion with the negative effect of alcohol. The type of drink can make you dehydrate. If you drink too much alcohol in party, make sure that you can balance the fluid in the body by consuming much water too.
Alcohol facts Alcohol 10 Interesting Alcohol Facts
Alcohol facts: Alcohol

2.Divorce
It seems that alcohol is not only related with health. A study in England tells people that there is relationship between divorce and alcohol. The study states that one third of the divorces in England is because of alcohol abuse.
Alcohol facts alcohol effect 10 Interesting Alcohol Facts
Alcohol facts: alcohol effect

3.Depressant effect
There are so many negative impacts that people will face when they consume this liquid. For the first time, you will be energetic. The good point is only a while for alcohol is a depressant. By consuming alcohol for many times, you can shut some part of your brain.
Alcohol facts alcoholism 10 Interesting Alcohol Facts
Alcohol facts: alcoholism.

4.A bad diet
The people who like to have a great body shape may think quitting alcohol. You need to know that the drink can stimulate you to eat more food. Thus, the dream of getting slim and wonderful body cannot be realized.
Alcohol facts Child Drinking Alcohol 10 Interesting Alcohol Facts
Alcohol facts: Child Drinking Alcohol

5.Liver failure
The people who consume much alcohol in the life may be affected by many health problems. One of the diseases includes liver failure. There is a strange long term effect that people will face. This disease is called as Korsakoff’s Psychosis.
Alcohol facts drink 10 Interesting Alcohol Facts
Alcohol facts: drink

6.Depression
Some people think that alcohol is the best solution out of the stress, anxiety, and depression. The depressed people love to enjoy the alcohol for they think that it can make them cheer up and happy. This step actually can make their depression even worse.
Alcohol facts drinking party 10 Interesting Alcohol Facts
Alcohol facts: drinking party

7.Red wine
Red wine is famous among the people because of its wonderful and delicious taste. The product usually contains resveratrol. It is considered as a powerful antioxidant for the body. Today the red wine is made to benefit your health.
Alcohol facts liquor 10 Interesting Alcohol Facts
Alcohol facts: liquor

8.Drinking people
The recent study states that one third of people drink alcohol. The people who like to drink more alcohol are the ones from Europe and Russia.
Alcohol facts man drinking alcohol 10 Interesting Alcohol Facts
Alcohol facts: man drinking alcohol

9.Sterilization  
Even though we talk much about the bad impact of alcohol, you need to know that it has a good side too. One of them is the ability of this liquid to banish bacteria. Thus, the paramedic sometimes uses it to sterilize some objects.
Alcohol facts no alcohol  10 Interesting Alcohol Facts
Alcohol facts : no alcohol

10.Kids
It seems that alcohol not only affects the grown people, kids are curios to try this liquid. It is revealed that half kids actually drink this liquid when they are in the 9th grade.
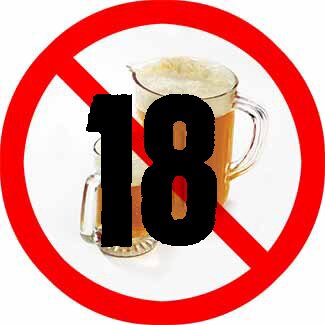
Alcohol facts no alcohol sign 10 Interesting Alcohol Facts
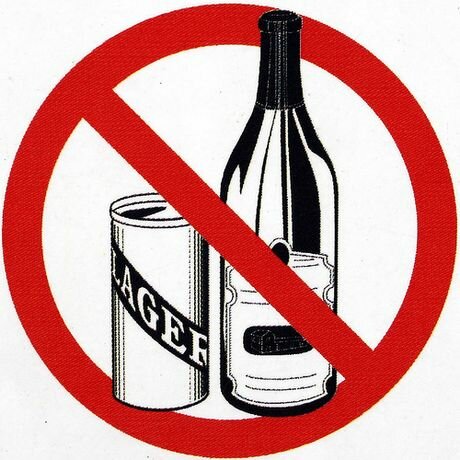
Alcohol facts: no alcohol sign

Laboratory monitoring systems and temperature recording

Laboratory monitoring systems and temperature recording


  • Monitor and secure the condition of your samples and products
  • Provide information about your laboratory equipment
  • Contribute to your audit trail
  • Guard against human error
  • Warn of equipment failure or doors left open
  • Prevent costly product losses
  • Assist compliance with quality norms (ISO, CCKL, GMP, GLP, FDA, etc)


Monitor your laboratory and critical equipment for:
  • temperature
  • CO2
  • relative humidity
  • O2
  • pressure and flow
  • particles
  • door opening
  • and more......

Think, Eat, Save: FAO, UNEP and partners launch global campaign on food waste


Think, Eat, Save: FAO, UNEP and partners launch global campaign on food waste


Consumers, industry, government can all help to reduce 1.3 billion tonnes of yearly waste and losses

Photo: ©FAO/Marco Salustro
Consumers and retailers can help to reduce food waste.
22 January 2012, Geneva/Rome - Simple actions by consumers and food retailers can dramatically cut the 1.3 billion tonnes of food lost or wasted each year and help shape a sustainable future, according to a new global campaign to cut food waste launched today by the Food and Agriculture Organization (FAO), the UN Environment Programme (UNEP), and partners.
The Think.Eat.Save. Reduce Your Foodprint campaign is in support of the SAVE FOOD Initiative to reduce food loss and waste along the entire chain of food production and consumption - run by the FAO and trade fair organizer Messe Düsseldorf - and the UN Secretary General's Zero Hunger Initiatives. The new campaign specifically targets food wasted by consumers, retailers and the hospitality industry.

The campaign harnesses the expertise of organizations such as WRAP (Waste and Resources Action Programme), Feeding the 5,000 and other partners, including national governments, who have considerable experience targeting and changing wasteful practices.

Think.Eat.Save. aims to accelerate action and provide a global vision and information-sharing portal for the many and diverse initiatives currently underway around the world.

Worldwide, about one-third of all food produced, worth around $1 trillion, gets lost or wasted in food production and consumption systems, according to data released by FAO. Food loss occurs mostly at the production stages - harvesting, processing and distribution - while food waste typically takes place at the retailer and consumer end of the food-supply chain.

"In a world of seven billion people, set to grow to nine billion by 2050, wasting food makes no sense - economically, environmentally and ethically," said UN Under-Secretary-General and UNEP Executive Director Achim Steiner.

"Aside from the cost implications, all the land, water, fertilizers and labour needed to grow that food is wasted - not to mention the generation of greenhouse gas emissions produced by food decomposing on landfill and the transport of food that is ultimately thrown away," he added. "To bring about the vision of a truly sustainable world, we need a transformation in the way we produce and consume our natural resources."

"Together, we can reverse this unacceptable trend and improve lives. In industrialized regions, almost half of the total food squandered, around 300 million tonnes annually, occurs because producers, retailers and consumers discard food that is still fit for consumption," said José Graziano da Silva, FAO Director-General. "This is more than the total net food production of Sub-Saharan Africa, and would be sufficient to feed the estimated 870 million people hungry in the world."

"If we can help food producers to reduce losses through better harvesting, processing, storage, transport and marketing methods, and combine this with profound and lasting changes in the way people consume food, then we can have a healthier and hunger-free world," Graziano da Silva added.

Sustainability


The global food system has profound implications for the environment, and producing more food than is consumed only exacerbates the pressures, some of which follow:

  • More than 20 per cent of all cultivated land, 30 per cent of forests and 10 per cent of grasslands are undergoing degradation;
  • Globally 9 per cent of the freshwater resources are withdrawn, 70 per cent of this by irrigated agriculture;
  • Agriculture and land use changes like deforestation contribute to more than 30 per cent of total global greenhouse gas emissions;
  • Globally, the agri-food system accounts for nearly 30 per cent of end-user available energy;
  • Overfishing and poor management contribute to declining numbers of fish, some 30 per cent of marine fish stocks are now considered overexploited.
Part of the trigger for the campaign was the outcome of the Rio+20 Summit in June 2012, in which Heads of State and governments gave the go-ahead for a 10-Year Framework of Programmes for Sustainable Consumption and Production (SCP) Patterns. Developing an SCP programme for the food sector must be a vital element of this framework, given the need to sustain the world's food production base, reduce associated environmental impacts, and feed a growing human population.

"There can be no other area that is perhaps so emblematic of the opportunities for a far more resource-efficient and sustainable world - and there is no other issue that can unite North and South and consumers and producers everywhere in common cause," said Mr. Steiner.

According to FAO, roughly 95 per cent of food loss and waste in developing countries are unintentional losses at early stages of the food supply chain due to financial, managerial and technical limitations in harvesting techniques; storage and cooling facilities in difficult climatic conditions; infrastructure; packaging and marketing systems.

However, in the developed world, the end of the chain is far more significant. At the food manufacturing and retail levels, large quantities of food are wasted due to inefficient practices, quality standards that over-emphasize appearance, confusion over date labels, and consumers being quick to throw away edible food due to over-buying, inappropriate storage and preparing meals that are too large.

Per-capita waste by consumers is between 95 and 115 kg a year in Europe and North America/Oceania, while consumers in sub-Saharan Africa, south and south-eastern Asia each throw away only 6 to 11 kg a year.

According to WRAP, the average UK family could save £680 per year ($1,090) and the UK hospitality sector could save £724 million ($1.2 billion) per year by tackling food waste.

"In the UK, we have shown how tackling food waste through engaging with consumers and establishing collective agreement with retailers and brands, reduces environmental pressures and aids economic growth," said Dr. Liz Goodwin, CEO of WRAP. "With a rising population, even more pressure is going to be put on resources, and we are excited to be a partner in UNEP and FAO's Think. Eat. Save. campaign, which is a great start to tackling food waste on a global scale."

In a similar vein for other parts of the world, the European Union is looking into the issue of food waste, and the European Commission has lent its weight to the new initiative.

"In the EU we have set ourselves a target to halve edible food waste by 2020 and to virtually eliminate landfilling by 2020; the Commission is planning to present ideas next year on the sustainability of the food system which will have a strong focus on food waste," said Janez Potočnik, European Commissioner for the Environment.

"Less food waste would lead to more-efficient land use, better water resource management, more sustainable use of phosphorus, and it would have positive repercussions on climate change. Our work fits perfectly with the launch of this initiative," he added.

For the campaign to reach its huge potential, everyone has to be involved - families, supermarkets, hotel chains, schools, sports and social clubs, company CEOs, city Mayors, national and world leaders.

SAVE FOOD: Global Initiative on Food Losses and Waste Reduction

Key Findings

  • Roughly one third of the food produced in the world for human consumption every year — approximately 1.3 billion tonnes — gets lost or wasted.
  • Food losses and waste amounts to roughly US$ 680 billion in industrialized countries and US$ 310 billion in developing countries.
  • Industrialized and developing countries dissipate roughly the same quantities of food — respectively 670 and 630 million tonnes. 
  • Fruits and vegetables, plus roots and tubers have the highest wastage rates of any food.
  • Global quantitative food losses and waste per year are roughly 30% for cereals, 40-50% for root crops, fruits and vegetables, 20% for oil seeds, meat and dairy plus 30% for fish.
  • Every year, consumers in rich countries waste almost as much food (222 million tonnes) as the entire net food production of sub-Saharan Africa (230 million tonnes).
  • The amount of food lost or wasted every year is equivalent to more than half of the world's annual cereals crop (2.3 billion tonnes in 2009/2010).
  • Per capita waste by consumers is between 95-115 kg a year in Europe and North America, while consumers in sub-Saharan Africa, south and south-eastern Asia, each throw away only 6-11 kg a year.
Per capita food losses and waste, at consumption and pre-consumptions stages, in different regions
  • Total per capita food production for human consumption is about 900 kg a year in rich countries, almost twice the 460 kg a year produced in the poorest regions.
  • In developing countries 40% of losses occur at post-harvest and processing levels while in industrialized countries more than 40% of losses happen at retail and consumer levels.
  • At retail level, large quantities of food are wasted due to quality standards that over-emphasize appearance.
  • Food loss and waste also amount to a major squandering of resources, including water, land, energy, labour and capital and needlessly produce greenhouse gas emissions, contributing to global warming and climate change.
  • The food currently lost or wasted in Latin America could feed 300 million people.
  • The food currently wasted in Europe could feed 200 million people.
  • The food currently lost in Africa could feed 300 million people.
  • Even if just one-fourth of the food currently lost or wasted globally could be saved, it would be enough to feed 870 million hungry people in the world.
  • Food losses during harvest and in storage translate into lost income for small farmers and into higher prices for poor consumers.
  • In developing countries food waste and losses occur mainly at early stages of the food value chain and can be traced back to financial, managerial and technical constraints in harvesting techniques as well as storage and cooling facilities. Strengthening the supply chain through the direct support of farmers and investments in infrastructure, transportation, as well as in an expansion of the food and packaging industry could help to reduce the amount of food loss and waste.
  • In medium- and high-income countries food is wasted and lost mainly at later stages in the supply chain. Differing from the situation in developing countries, the behaviour of consumers plays a huge part in industrialized countries. The study identified a lack of coordination between actors in the supply chain as a contributing factor. Farmer-buyer agreements can be helpful to increase the level of coordination. Additionally, raising awareness among industries, retailers and consumers as well as finding beneficial use for food that is presently thrown away are useful measures to decrease the amount of losses and waste.

Tuesday, 29 January 2013

Making the Most of a Safety Department of One

Making the Most of a Safety Department of One


If you're "it" when it comes to safety management in your organization—or if it just feels like it sometimes—here's some helpful advice.
Does your safety department consist of just you? With safety as such a key factor in morale and profitability, that’s a lot of responsibility on your shoulders.
  • How do you determine the best place to start, given limited time and money, to make sure you keep your workers safe and keep your company in compliance?
  • What should you be focusing on?
  • How do you make sure you stay on top of everything?
In a BLR webinar titled "Safety Department of One: How To Keep Workers Safe and Avoid Penalties for Noncompliance," Fran Sehn outlined some tips on the priorities for a safety department of one.
Sehn is the Assistant Vice President, Casualty Risk Control Services, for Willis of Pennsylvania, Inc. His consulting work also includes providing safety audits, hazard assessments and safety training for a variety of manufacturing, commercial and industrial clients.
Sehn says there are several important steps you can take to have world-class safety, even without many people on your team.
Determine the managerial perspective on safety within your organization. This is the single most important thing to turn your attention toward before anything else, as it will set the tone for your ability to drive safety initiatives; this information will determine the direction of the health and safety initiatives in the organization and will tell you how much support you will have. You will want to know whether the safety attitude is reactive or proactive. 
Analyze the current state of safety in the organization. This can be done with an initial SWOT analysis (Strengths, Weaknesses, Opportunities, and Threats). This will prove valuable for planning the safety process going forward.
Align safety with the business goals and objectives. Reviewing the mission statement and overall goals of the organization will help align the safety process. The results of the review will determine the direction; it may be compliance, the creation of a safety management system, or some combination of the two. Sehn says that "most safety professionals can do the compliance part . . . [but] to take the program to another level you really need to look at how we integrate safety into the process. What do we do from a hazard assessment, a risk-assessment standpoint? How do we take those kind[s] of things and really embed it into the business practices?" Compliance is part of this, but a dynamic safety management system will combine the two to prevent incidents from occurring.
Understand your legal requirements. The OSHA standards you’re subject to depend on what industry you’re in, but everyone has to be familiar with some of the regulations. Take steps to ensure you understand all of the requirements applicable to your organization.
Develop a safety plan. The safety professional must look at safety from a business plan standpoint. A budget for safety may be required by some companies. The cost of safety may require a return on investment. The safety professional must perceive safety as a business process.

WHY TREAT YOUR COOLING WATER?

WHY TREAT YOUR COOLING WATER?


In today's world of expensive energy, it is more vital than ever for heat exchange equipment to be kept free of insulating deposits that promote high energy consumption. The four principal sources of these deposits in the case of water cooled systems are: scale, corrosion, biological growths and sludge. These factors are important for another reason: they have a direct effect on equipment life.

SCALE
Caused by the precipitation of calcium and other salts of limited solubility, scale, in addition to its high insulating value, progressively narrows pipe internal diameters and roughens tube surfaces, thereby impeding proper flow.

In compression refrigeration systems, scale translates into higher head pressures, hence an increase in power requirements and costs. For example, 1/8" of scale in a 100 ton refrigeration unit represents an increase of 22% in electrical energy compared to the same size unit free of scale. Similarly, in absorption systems, scale creates a higher back pressure on the concentrator, increasing energy expenditure.

While scale formation proceeds more rapidly in open recirculating systems owing to the concentration effect of evaporation, once-through systems are not exempt from scaling if high temperatures are combined with silt and iron.


CORROSION
Dissolved gases, improper pH control or formation of differential aeration cells under deposits cause corrosion to be undoubtedly the single most significant factor leading to the premature deterioration of HVAC equipment and piping. In its most insidious form, pitting, is only revealed when the equipment fails. Failures of this type can be catastrophic, leading to costly downtime for repairs and equipment replacement, personal discomfort and even total plant shutdown.

BIOLOGICAL GROWTHS
Apart from their well known role in promoting corrosion, through the formation of acid metabolic products or through the mechanism of concentration cells associated with deposits of all kinds, the uncontrolled multiplication of bacteria, algae and fungi, results in bio-film formation on heat exchange surfaces and has now been recognized as an important contributor to impaired heat transfer efficiency in cooling water systems.

In fact, it has been unequivocally demonstrated that because of the unique surface characteristics of bio-films, their hydrodynamic and insulating properties far exceed those of an equivalent thickness of scale or corrosion deposits.

Of particular concern are the slime and spore formers which are difficult to control because of the protection afforded by the polysaccharide sheaths that they secrete and the organisms that metabolize either cellulose or lignin, resulting in structural weakness and eventual collapse of wooden tanks or towers.


SLUDGE
Under this heading is included dirt, mud, sand, silt, clay, scale salts, and other particulates of airborne origin or entering the system with the makeup water. Very often these suspended solids are tightly bound and cemented by corrosion products and organic matter.

Where abrasive, sludge deposits can damage pump seals and in addition to their insulating nature can also promote "under-deposit" corrosion.

The answer to the aforementioned problems created by scale, corrosion, bio-fouling and sludge is, of course, a comprehensive water treatment program comprising scale and corrosion inhibitors, microbiocides and dispersants coupled with adequate bleedoff and appropriate equipment.

Water is lost from a cooling tower system through evaporation, leaks in the system , overflow of the cooling tower sump, and "bleed", which is the intentional draining of a certain amount of water in order to decrease the buildup of solids in the system. In a poorly designed system, high winds can blow some of the water out onto surrounding areas. "Make-up" water is the water brought into the system to replace lost water, regardless of the cause of water loss. The makeup water formula is:
Make-up water = water lost (through evaporation + bleed + leaks + windage)
When water is evaporated or lost from a cooling tower, the solids and chemicals used to treat the tower remain in the system. When water is "bled" from the system, the chemicals lost through bleed must be replaced for the system to remain protected.

Urea fertilizer... the basics

Urea fertilizer... the basics


Urea is the most widely used solid N fertilizer in the world. Urea is also commonly found in nature since it is expelled in the urine of animals. The high N content of urea makes it efficient to transport to farms and apply to fields.
Production
The production of urea fertilizer involves controlled reaction of ammonia gas (NH3) and carbon dioxide (CO2) with elevated temperature and pressure. The molten urea is formed into spheres with specialized granulation equipment or hardened into a solid prill while falling from a tower.
During the production of urea, two urea molecules may inadvertently combine to form a compound termed biuret, which can be damaging when sprayed onto plant foliage. Most commercial urea fertilizer contains only low amounts of biuret due to carefully controlled conditions during manufacturing. However, special low-biuret urea is available for unique applications.
Urea manufacturing plants are located throughout the world, but most commonly located near NH3 production facilities since NH3 is the major input for urea. Urea is transported throughout the world by ocean vessel, barge, rail, and truck.
 
                 Chemical Properties
                    Chemical Formula:           CO(NH2)2
                    N content:                         46% N
                    H2O Solubility (20ºC):       1,080 g/L
Agricultural Use
Urea is used in many ways to provide N nutrition for plant growth. It is most commonly mixed with soil or applied to the soil surface. Due to the high solubility, it may be dissolved in water and applied to soil as a fluid, added with irrigation water, or sprayed onto plant foliage. Urea in foliar sprays can be quickly absorbed by plant leaves.
After urea contacts soil or plants, a naturally occurring enzyme (urease) begins to quickly convert the urea back to NH3 in a process called hydrolysis. During this process, the N in urea is susceptible to undesirable gaseous losses as NH3. Various management techniques can be used to minimize the loss of this valuable nutrient.
Urea hydrolysis is a rapid process, typically occurring within several days after application.  Plants can utilize small amounts of urea directly as a source of N, but
they more commonly use the ammonium (NH4+) and nitrate (NO3-) that are produced after urea is transformed by urease and soil microorganisms.
 
Management Practices
Urea is an excellent nutrient source to meet the N demand of plants. Because it readily dissolves in water, surface-applied urea moves with rainfall or irrigation into the soil. Within the soil, urea moves freely with soil water until it is hydrolyzed to form NH4+. Care should be used to minimize all N losses to air, surface water, and groundwater. Avoid urea applications when the fertilizer will remain on the soil surface for prolonged periods of time. Undesired N losses may also result in loss of crop yield and quality.
Urea is a high N-containing fertilizer that has good storage properties and causes minimal corrosion of application equipment. When properly managed, urea is an excellent source of N for plants.
Non-agricultural Use
Urea is commonly used in a variety of industries. It is used in power plants and diesel exhaust systems to reduce emission of nitrous oxide (NOx) gases. Urea can be used as a protein supplement in the diet of ruminant animals, such as cattle. Many common industrial chemicals are made using urea as an impor­tant component.

What is in your nitrogen budget?

What is in your nitrogen budget?


Nitrogen cycle in soil
Nitrate fertilizer management is under intense discussion in California.  A newly released report by the University of California has documented the wide-spread presence of nitrate in groundwater in major agricultural regions (groundwaternitrate.ucdavis.edu).  As a result of these studies, state regulatory agencies are now proposing a variety of steps to help improve nitrogen fertilizer management.
With closer scrutiny on nitrogen fertilization practices, farmers are being asked to balance the inputs of nitrogen on each field with the amount of nitrogen removed during harvest.  This is similar to balancing a checkbook where all deposits must be reconciled the withdrawals. You will be hearing more about how to do this for your clients in the coming months.
Before you begin to construct your nitrogen budget, the first step is to estimate a realistic yield for each field and crop.  This allows you to calculate how much nitrogen will be removed in the harvested crop.  Remember that it will take more nitrogen to grow a plant than the quantity removed in the harvested portion since leaves, roots, and other plant parts are often left in the field. This website is useful in estimating nutrient removal during harvest: (www.plants.usda.gov.npk).
Nitrogen Inputs to Know:
Residual nitrogen in the soil.  Soil testing will provide valuable information on how much nitrate is present in the rootzone before you begin the growing season.  Be sure to consider where the growing roots will be and then sample in this zone.  Always try to keep the amount of residual nitrate in the soil as low as possible when there is no active plant growth.
Field with vegetable transplants
Nitrogen release from crop residue, manure, and soil organic matter.  Organic matter will slowly release nutrients during the growing season.  Some organic materials will release nitrogen very quickly (a week or two), while other materials (such as stable composts) can require months or years to release their nutrients.  Release of nitrogen from soil organic matter is a slow and steady process in most California agricultural soils.
Irrigation water may already contain significant amounts of nitrate.  The amount of nitrate added with the water during the growing season should be considered in the total nitrogen supply.  Using nitrate in the irrigation water is sometimes called “pump and fertilize”.  Be sure to have the irrigation water analyzed to know what you are adding. Each ppm of nitrate-nitrogen contributes 2.7 pounds of N with each acre foot of water (for example, irrigation water with a concentration of 10 ppm nitrate-nitrogen would supply 27 lb N in one acre foot of water)
Liquid fertilizer added to irrigation water
Nitrogen fertilizer makes up the difference to meet crop demand.  Once all the sources of nitrogen are accounted for, the remaining crop requirement can be met by added fertilizer.  Not all of the added fertilizer will end up in the crop since there are always some unavoidable losses, but these can be kept to a minimum.
You already know that there is a lot of skill and art required to manage fertilizer nitrogen.  This involves using your local expertise to decide issues such as:
Right Source: Nitrogen fertilizers are most commonly supplied as nitrate, ammonium, or urea.  Each one of these behaves differently in the soil.  You may want to consider if some of the nitrogen inhibitors (urease inhibitors or nitrification inhibitors) may work for you to keep nitrogen in its place.  New controlled-release fertilizers may also provide some excellent management options.
High-yielding strawberries
Right Rate: This can be a difficult number to define.  We have good general recommendations from sources such as the University of California, but fields often have low and high-yielding areas and then yields may fluctuate due to weather or alternate bearing factors.  Careful record keeping over multiple years will help document realistic yield goals and in developing an appropriate fertilizer plan.  Using tools such as soil nitrate testing, petiole analysis, or tissue testing will provide valuable feedback during the growing season with which management decisions can be made.
Even simple practices such as periodically calibrating the fertilizer spreader or performing maintenance on fertilizer injection equipment will make sure the right rate is being added. 
Right Time:  Do you need an application of starter fertilizer and what type of nitrogen is most appropriate (urea, ammonium, or nitrate)?  How will the crop respond to split applications of N?  How many splits are desirable or feasible?  When does the crop have the greatest demand for nitrogen?  Applying nitrogen too early or too late for the specific crop will result in lost yield, reduced quality, and wasted fertilizer.
Right Place: Plant nutrients need to be near the roots to be effective.  Some nitrogen sources move easily with water, while others are less mobile.  Are you using water to move the nitrogen to the root zone?  If so, don’t over irrigate or else nitrate can be pushed below the rootzone and be lost.  It is not practical to use foliar fertilization for the majority of the crop requirement, but it may have a role in fine-tuning plant nutrition during the growing season.
Irrigated onions
Watch your irrigation practices: All the careful attention to nitrogen management can be cancelled out by misapplication of irrigation water.  Nitrate and urea are very soluble and move freely with water in the soil.  When irrigation water moves past the root zone, it carries these nutrients with it.  Meeting plant water demands while avoiding nitrogen leaching is very challenging, especially with shallow-rooted crops.  Extra water additions for salt management should take place after the growing season when nitrate concentrations in the soil are at their lowest.  Appropriate irrigation and careful nitrogen management are inextricably linked.
Irrigated sugarbeets
 We will be hearing much more about nitrogen management in the years to come.  Take time to review these fundamentals so you will be ready to help your clients with their crop nutrition needs.
 Robert Mikkelsen, International Plant Nutrition Institute, Merced, CA,  rmikkelsen@ipni.net,

  http://works.bepress.com/robert_mikkelsen/14/


The 4R's... Is it all about the Application Rate?

The 4R's... Is it all about the Application Rate?


Fertilizer spreader
It seems that discussions by government regulators to minimize nutrient impacts immediately turn to reducing the rate of fertilizer application. While this approach has the advantage of simplicity and being easy to measure, a narrow focus on fertilizer application rate alone will consistently fall short of achieving the desired environmental and economic goals.

Selecting the Right Rate of fertilizer application is only one of the 4R’s that must be considered when making nutrient decisions. In addition to selecting the Right Rate, it is also essential to choose the Right Source, the Right Time, and the Right Place to get the maximum value. When one of these 4R’s is changed, it is necessary to evaluate how it impacts the remaining 4R factors.

Here are a few examples of how only modifying the fertilizer application rate may not achieve the desired results:

• It is important that growing crops have the right combination of all nutrients present in the rootzone, especially during periods of peak demand. If the nutrient supply during these critical times is not adequate to support growth then crop yields and quality will suffer.

• Nutrient applications should be made as close to the time of plant uptake as feasible. Some nutrients can be placed in the soil in advance of plant uptake because of their limited mobility; however other nutrients are at risk of loss if they remain in the soil for an extended period of time.

• When organic materials are used as a plant nutrient source, a period of mineralization is required before the nutrients are converted to a form that can be taken up by roots. Sufficient time is required for mineralization to synchronize nutrient release with plant uptake.

Elephant manure spreader?
• Adequate soil moisture is needed for dissolved nutrients to be taken up by roots. Uncertainties in rainfall patterns make the prediction of fertilizer rate an ever-changing target each year. When crops are irrigated, nutrient loss is closely associated with water distribution and irrigation uniformity across the field.

• There are numerous examples to show that when plants are not supplied with a balanced and appropriate supply of all the essential nutrients, none of them will be fully used to their potential. For example if a soil is low in K, then nitrate will not be properly taken up and may be more prone to leaching loss. 

 • Some fertilizer sources are more suitable for placement close to the seed than other sources, which may cause damage to germinating seedlings. Placing fertilizer close to the seed can provide some early-season growth stimulation in some circumstances.

Examples of controlled-release fertilizer
• Technology can be used to help keep nutrients in the proper place. For example the use of a nitrification inhibitor may reduce both nitrate leaching and denitrification losses from some N fertilizers. Similarly, a urease inhibitor can minimize ammonia loss and improve nutrient recovery from urea applied to the soil surface.

• Controlled-release technology can reduce the risk of nutrient loss and eliminate the need for multiple trips through the field to apply fertilizer. Enhanced nutrient recovery by plants is often reported when these nutrient sources are used.

• Custom blends of fluid fertilizers allow a precise combination of nutrients to be delivered to the soil in each drop. Each droplet provides uniform and consistent nutrition to the plant. Some compound fertilizers and additives are formulated to control the soil environment around the granule to enhance plant nutrient recovery.

Fertilizer is essential to sustaining food production

These few examples illustrate how an overly narrow focus on fertilizer application rate alone can cause growers to miss their overall objective—that is growing a high yielding and high quality crop that is both economically profitable and environmentally sound. When the 4R Nutrient Stewardship approach is implemented on each field, it is clear that no one of them can dominate nor be excluded. It is NOT all about the fertilizer application rate, because the source, time, and place decisions must all be considered to get the rate right.