Ministry of Agriculture & Farmers Welfare31-May, 2019 16:19 IST
Department of Agriculture, Cooperation and Farmers Welfare Releases the Second Advanced Estimate (2018-19) of Area and Production of various Horticulture Crops
Department of Agriculture, Cooperation and Farmers Welfare has released the Second Advanced Estimate (2018-19) of Area and Production of various Horticulture Crops, as compiled from information received from different State/UTs and source agencies. Highlights
The Total Horticulture Production of the country is estimated to be 314.87 Million Tonnes which is 1.01% higher than Horticulture Production in 2017-18.
Total Horticulture
2017-18
2018-19
(Second Advanced Estimate)
Area
(Million Ha)
25.43
25.61
Production
(Million Tonnes)
300.64
314.87
Fruits Production is estimated to be around 97.38 Million Tonnes, compared to 97.36 Million Tonnes in last year.
Vegetables Production is estimated to be around 187.36 Million Tonnes, which is 1.61% higher than Production in 2017-18.
Onion Production is estimated to be around 23.28 Million Tonnes, which is slightly higher than production in 2017-18.
Potato Production is estimated to be around 52.96 Million Tonnes, which is 3.2% higher than Production in 2017-18.
Tomato Production is estimated to be around 19.66 Million Tonnes, which is 0.5%, lower than Production in 2017-18.
Spices Production is estimated to be around 8.61 Million Tonnes, which is 6.01% higher than Production in 2017-18.
Air pollution is a growing problem for of the most world cities. In response to the deteriorating urban health and growing civic demand, scientists and policy makers have recognized the need for an integrated air quality management, for better urban planning and clean air. A majority of the existing tools for integrated assessment are complex and data-intensive. There is a need to develop an organized knowledge base to feed into a robust decision support tool that takes into account the various institutional and technical challenges in developing countries.
The SIM-air family of tools “Simple Interactive Models for better air quality” are developed with one objective – make use of the best available information with the academic, government, and non-governmental bodies, in order to support integrated air quality management, whose schematics are presented to the right. The tools are designed to collate the necessary information, to estimate key parameters (e.g. emissions from various sources) and to simulate the interactions between emissions, pollution dispersion, impacts, and management options in an environmental and economic context.
Please cite appropriately and if you have any questions on the tools, suggestions to improve the tools, or want to share your experiences while using the tools, please email to simair@urbanemissions.info
So far, the SIM-air family of tools include the following
The SIM-air Model (V1.3, V2.0, and V3.0) – An integrated air pollution analysis tool to go from estimating emissions to pollution to impacts for a set scenario and also perform optimization among options for better air quality; Browse under the “Modeling Tools/SIM-air” tab to access the case studies from various cities
VAPIS – Vehicular Air Pollution Information System – A vehicular emissions calculator to estimate and compare emissions inventory; including a repository of emission factor databases
Air Quality Index Calculator – A simplified calculator, which is commonly used in a number of cities across the world, designed to plug your monitoring data to estimate either real time or forecasted AQI (Click here for an infograph on how to calculate AQI)
ATMoS Dispersion Model – The Atmospheric Transport Modeling System – A (fortran language based) simplified lagrangian dispersion model to generate transfer matrices for multiple source and multiple pollutant types; for direct input to the SIM-air model
Along with the tools, we maintain SIM-air working paper series published in addition to our peer-reviewed publications, where methodologies, applications, and references on the air pollution modeling, emissions inventories, source apportionment, air quality management, and co-benefits analysis from cities and regions are published. The series is an open-resource and available for free. However, please cite the articles appropriately when used.
Latest in the series are
SIM‐39‐2012 ‐‐ Urban air pollution and co-benefits analysis for Indian cities
SIM‐38‐2012 ‐‐ A Multi‐pollutant emissions inventory for National Capital Region of Delhi, India
SIM‐37‐2012 ‐‐ An Analysis of health & carbon co‐benefits for Pune, India
SIM‐36‐2011 ‐‐ Air Quality Forecasting System for Cities: Modeling Architecture for Delhi, India
SIM‐35‐2010 ‐‐ AQI for Delhi, India: Trend Analysis & Implications to 2010 CW Games
SIM‐34‐2010 ‐‐ Air Quality Index (AQI): Methodology & applications for public awareness in Cities
Regular updates on the SIM-air tools and the SIM-air working paper series are sent to the members of the SIM-air mailing list. If you want to join the list, please send an email to with a brief description of your research.
sim-air
Simple Interactive Models for better Air quality (SIM-air)
DelhiAir Quality Forecasts – District Average PM2.5 Source Contributions
Air pollution has emerged as a major challenge in Delhi and the problem becomes more complex due to multiplicity and complexity of the mix of emission sources, such as, industries, automobiles, generator sets, domestic fuel burning, road side dusts, construction activities, etc. To support Delhi’s air pollution management, a modeling framework to simulate pollution movement for the next 72-hours was put together, using meteorology processed through 3D-WRF meteorological model and the GFS meteorological fields and the concentrations simulated through the CAMx chemical transport modeling system.
Using the CAMx model, which allows for particulate source apportionment, a series of simulations are conducted every day to answer this question, based on a detailed spatially and temporally resolved emissions inventory. The hourly average source contributions (presented below) is a modeled average for all the 1 km x 1 km grids overlapping in each of the district. A map showing the geographical extent of each of the districts is presented here (along with a kml file for reference and use). The modeling domain considered for this exercise includes 14 districts – 9 in Delhi, 2 in Haryana, and 3 in Uttar Pradesh.
What is included in the 7 clubbed source categories is described below and more information on the emission sources is available here. If you click on any of the source categories in the legend, it will allow you to minus that contribution and see what could be the PM2.5 concentrations without its contribution. If you click on it again, the source will added back to the chart.
The data fields are updated everyday at ~7:00 PM local time.
TRA.PASS = pollution from passenger vehicles (2Ws, 3Ws, 4Ws, Taxis, and Buses) including vehicle exhaust and associated resuspended dust
TRA.FRGT= pollution from freight vehicles (heavy and light trucks, and non-road vehicles) including vehicle exhaust and associated resuspended dust
URB.DUST = pollution from road dust resuspension and construction activities
RESI = pollution from domestic cooking, space heating, water heating, and lighting
IND.BK = pollution from industrial activities and brick kilns
PP.GS = pollution from power plants and in-situ diesel generator sets
WST.BURN = pollution from open waste burning
OTHERS = pollution from small and intermittent sources, like fireworks and funeral homes
OUTSIDE = pollution linked to boundary conditions, in other words, pollution from outside the 80 km x 80 km modeling domain; which is calculated from a simulation over the Indian subcontinent, including the anthropogenic emissions, seasonal fires and dust events (calculated based on the most recent satellite data), and other natural sources
A prerequisite to a good air quality model is a well understood emissions inventory – spatially and temporally, accounting for all the known anthropogenic sources and the non-anthropogenic sources. This is a challenging task that require customized approaches, as the critical pollutants, sources, meteorology, geography, population distribution, history, institutions, and information base vary significantly between regions and with in the region like India.
Click on the icons below, to access emission summaries for various sectors and brief background on the data fields available for that sector and the methodologies employed to process the necessary fields into emissions inventory. The inventory includes data on multiple pollutants from all known activities in the Indian Sub-continent. All the sectors and the sub-sectors are maintained on GIS platform, with a switch in the dispersion model to include or exclude their emissions, any or all of them, for any day or any hour of the modeling exercise. This allows us to dynamically track (or not track) the aggregate pollution to any of the sources in the model (for example, if we know in advance that buses are on strike, we can exclude their emissions for those days or hours). The non-anthropogenic sources such as biogenics, dust events, fires, sea salt, and lighting emissions are modeled at the Indian sub-continent scale. In other words, if there is a fire event or a dust event detected in the satellite retrievals, we will have it reflected in the calculations and shown as boundary intrusion. More details on each of these sources is below.
During a question and answer session in Delhi late last year, I was asked this question “Since Diwali, the Delhi government has installed 20 continuous monitoring stations. Despite that, why are the pollution levels still so high?”. The simple answer to this is that monitoring is a diagnostic tool to assess levels of air pollution and in and off itself does not reduce any air pollution. What it does do, is provide a starting point for understanding the air pollution problem and a direction for addressing pollution control options.
This however got me thinking. Having worked on air pollution related research for my entire career, I have to constantly remind myself of a cognitive bias while communicating on matters related to air pollution. This means that I (unknowingly) assume that others also understand the concepts related to air pollution as I understand them. This type of bias tends to be reinforced when speaking to other “experts” and the only way to break out of this bias is to communicate as clearly as possible to people. There are several topics within air pollution that I would like to speak about – such as source apportionment, dispersion modelling, emissions inventory, etc. However, in this discussion I will focus solely on “air pollution monitoring”.
This note is my attempt to explain air pollution monitoring – What purpose does it serve? Is ambient monitoring the same as emissions monitoring? How does one monitor? How do “low-cost” monitors fit in? These are some of the questions, I will try to answer in this brief (all the references used in this piece are from India, but the notes is relevant for other countries as well).
What is Air Pollution Monitoring?
Monitoring is an exercise to measure ambient levels of air pollution in an area. The results of which indicate the status of quality of air we breathe. Monitoring data, over a long term, is especially useful as it allows us to tease out patterns that help support air pollution control policy. These patterns include, spatial differences in pollution (which areas of the city are more polluted) and temporal differences (is there a pattern of pollution levels during a day and/or a year). So, while air pollution monitoring itself does not reduce air pollution, it gives us clues as to where the pollution is coming from and what is its level. By providing a baseline, we also know if our efforts for improving the quality of air are bearing fruit or if we need to try other options or be more aggressive in our current efforts.
It is because monitoring informs air pollution policy, that it is often cited as an integral part (if not the key measure) of a pollution control strategy by policy makers, and by extension, the media. For example, here is an article from 2016 in the Hindustan Times that quotes, “The mobile air quality monitoring unit will be capable of real-time sampling, analysis and control of air pollution from sources..”. This statement can be misleading, as it could be read that the mobile unit will make rounds of the city and “control” air pollution by sucking up pollution.
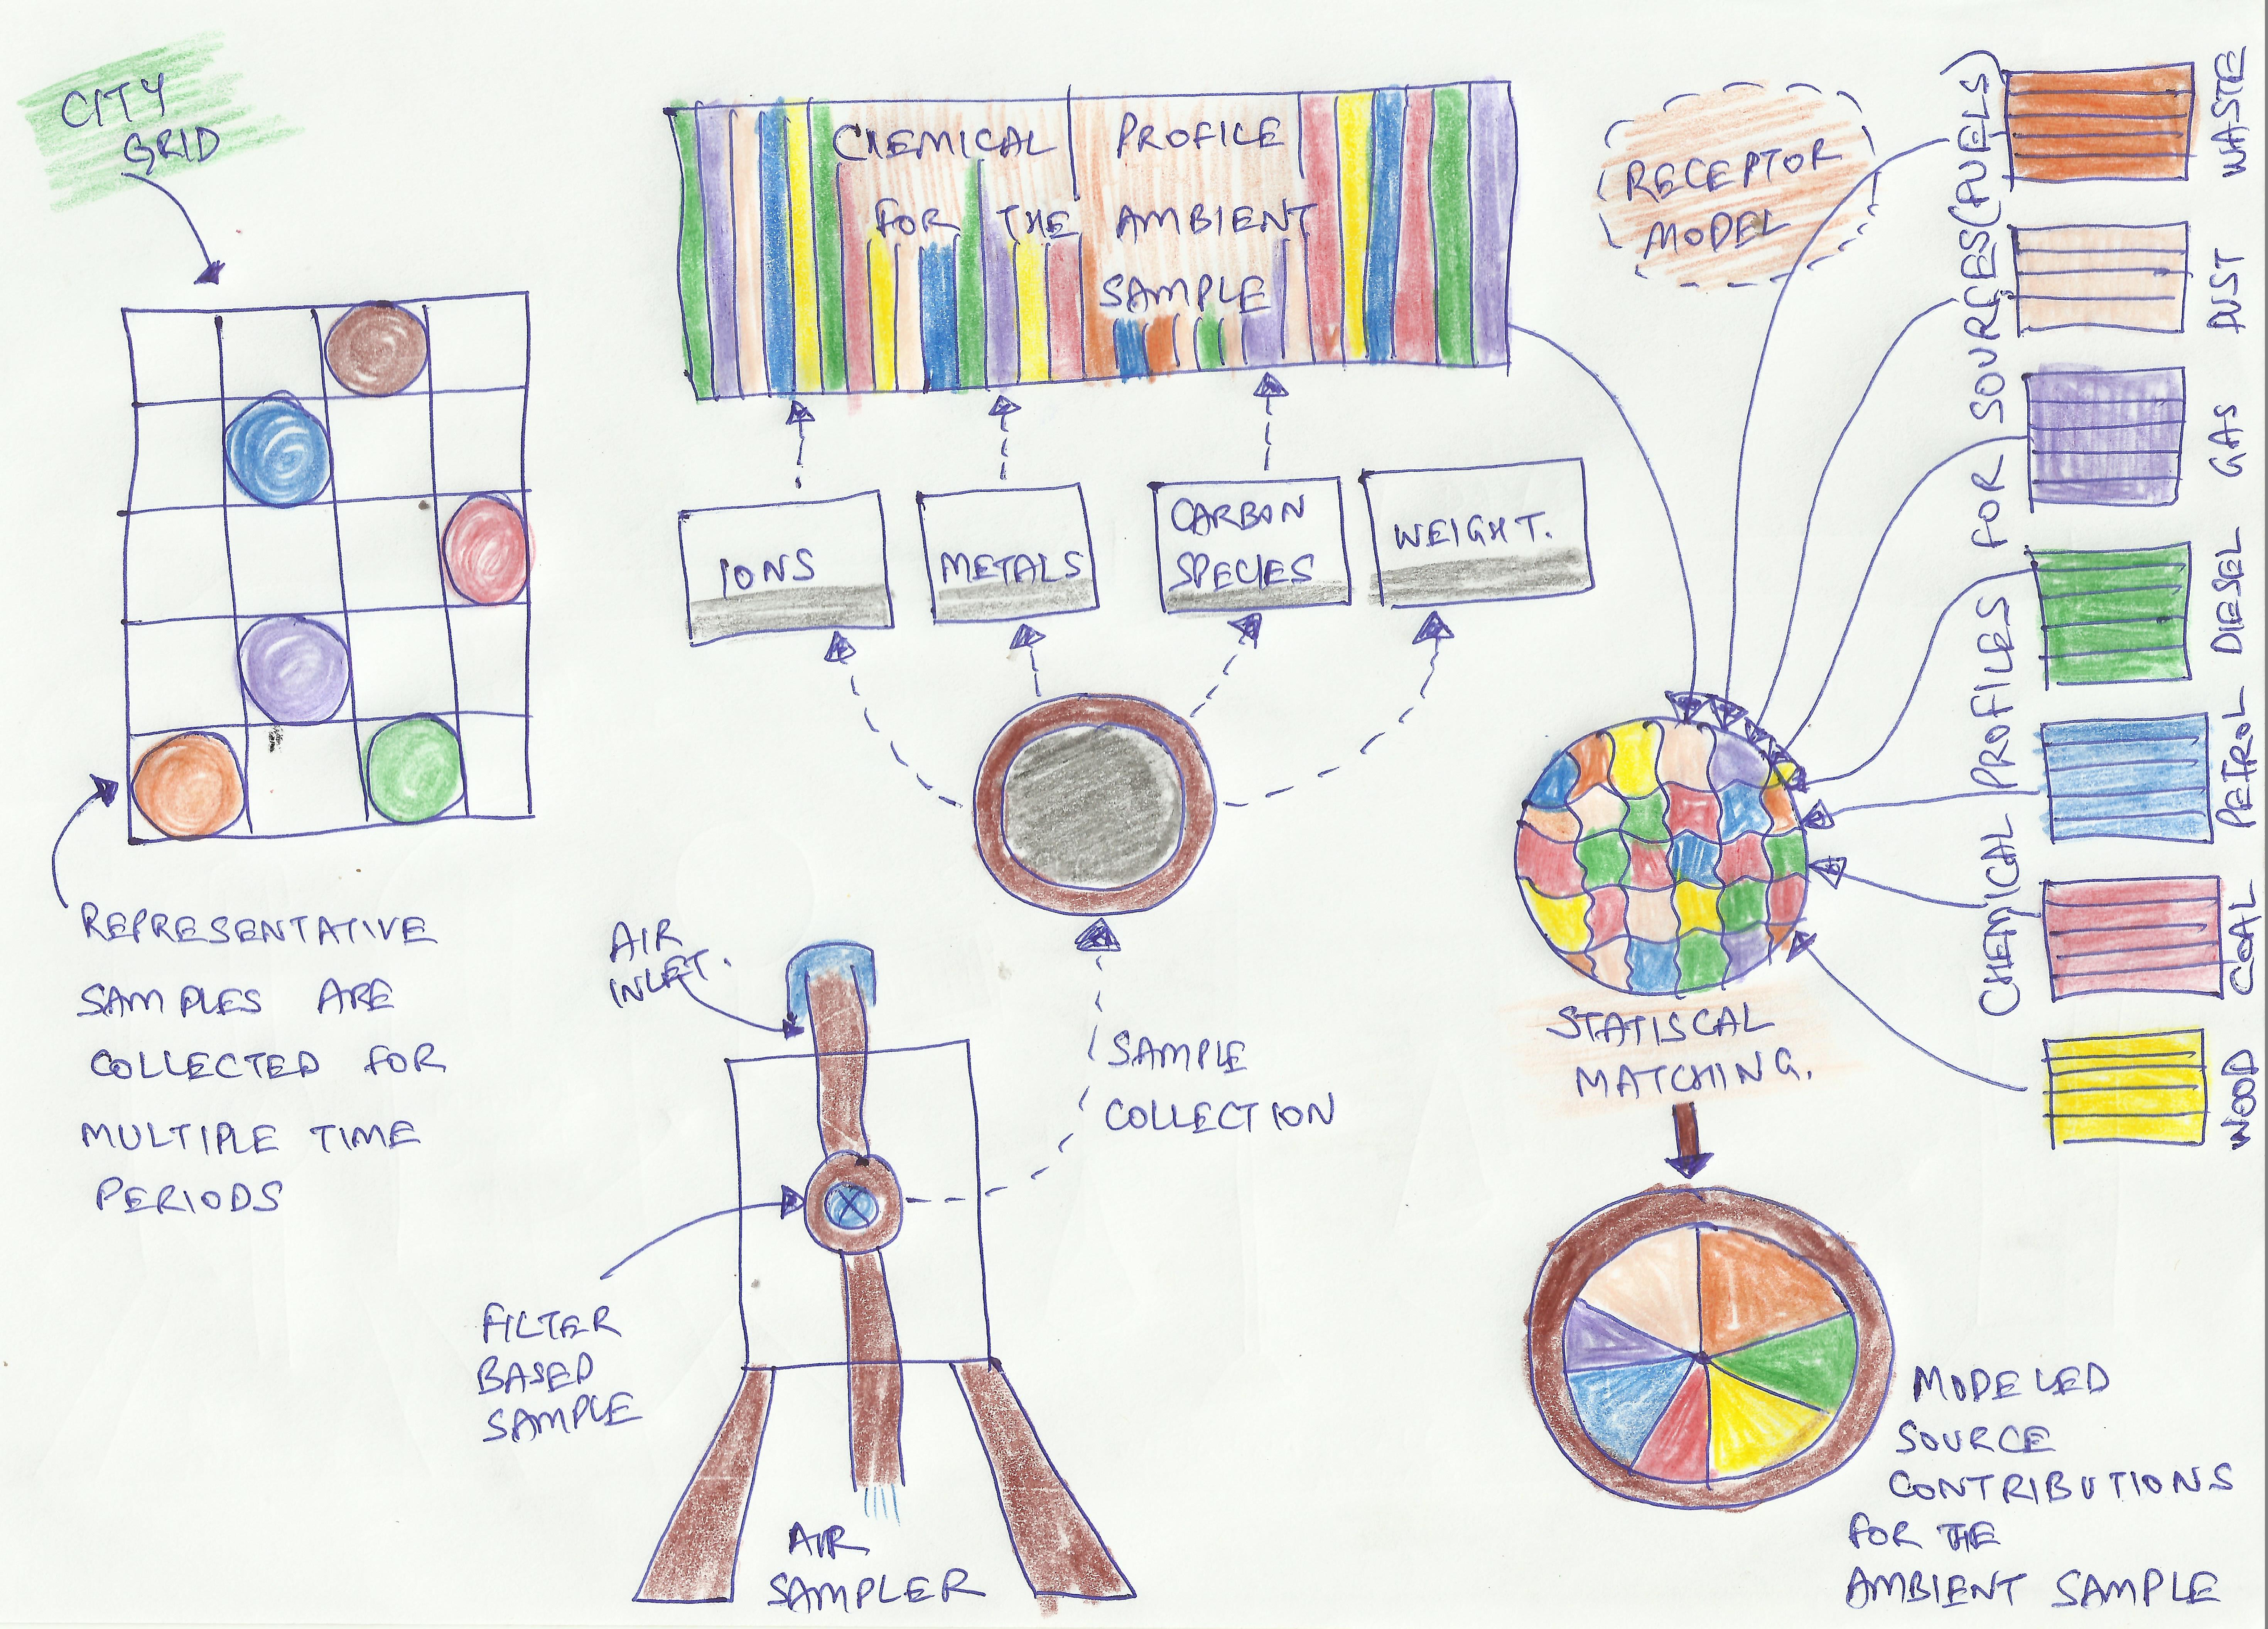
The filter based pollution samples can be chemically analyzed to determine contributing sources (for more on the methods, see the primer on source apportionment). The chemical analysis allows us to estimate how much of the pollution is a result of various fuels such as petrol, diesel, coal, biomass, waste, or dust, which can be statistically matched to ascertain the source contributions such as vehicular traffic, crop burning, power plants, industries, household cooking and heating, and so on.
Armed with this information, we can then control the level of pollutants in the air by reducing emissions at those sources – vehicle tail pipes, dust on the roads, construction sites, diesel generator sets, industries small and large, domestic and commercial cooking, space heating, water heating, open waste burning, and open biomass burning. Hence monitoring can be compared to a diagnostic tool that informs the course of action (the treatment) carried out through policy and implementation.
How does one Monitor Air Pollution?
Monitoring is the generic term used for methods to assess the level of air pollution. There are several types of monitoring, different ways of collecting this information, and multiple uses of this information
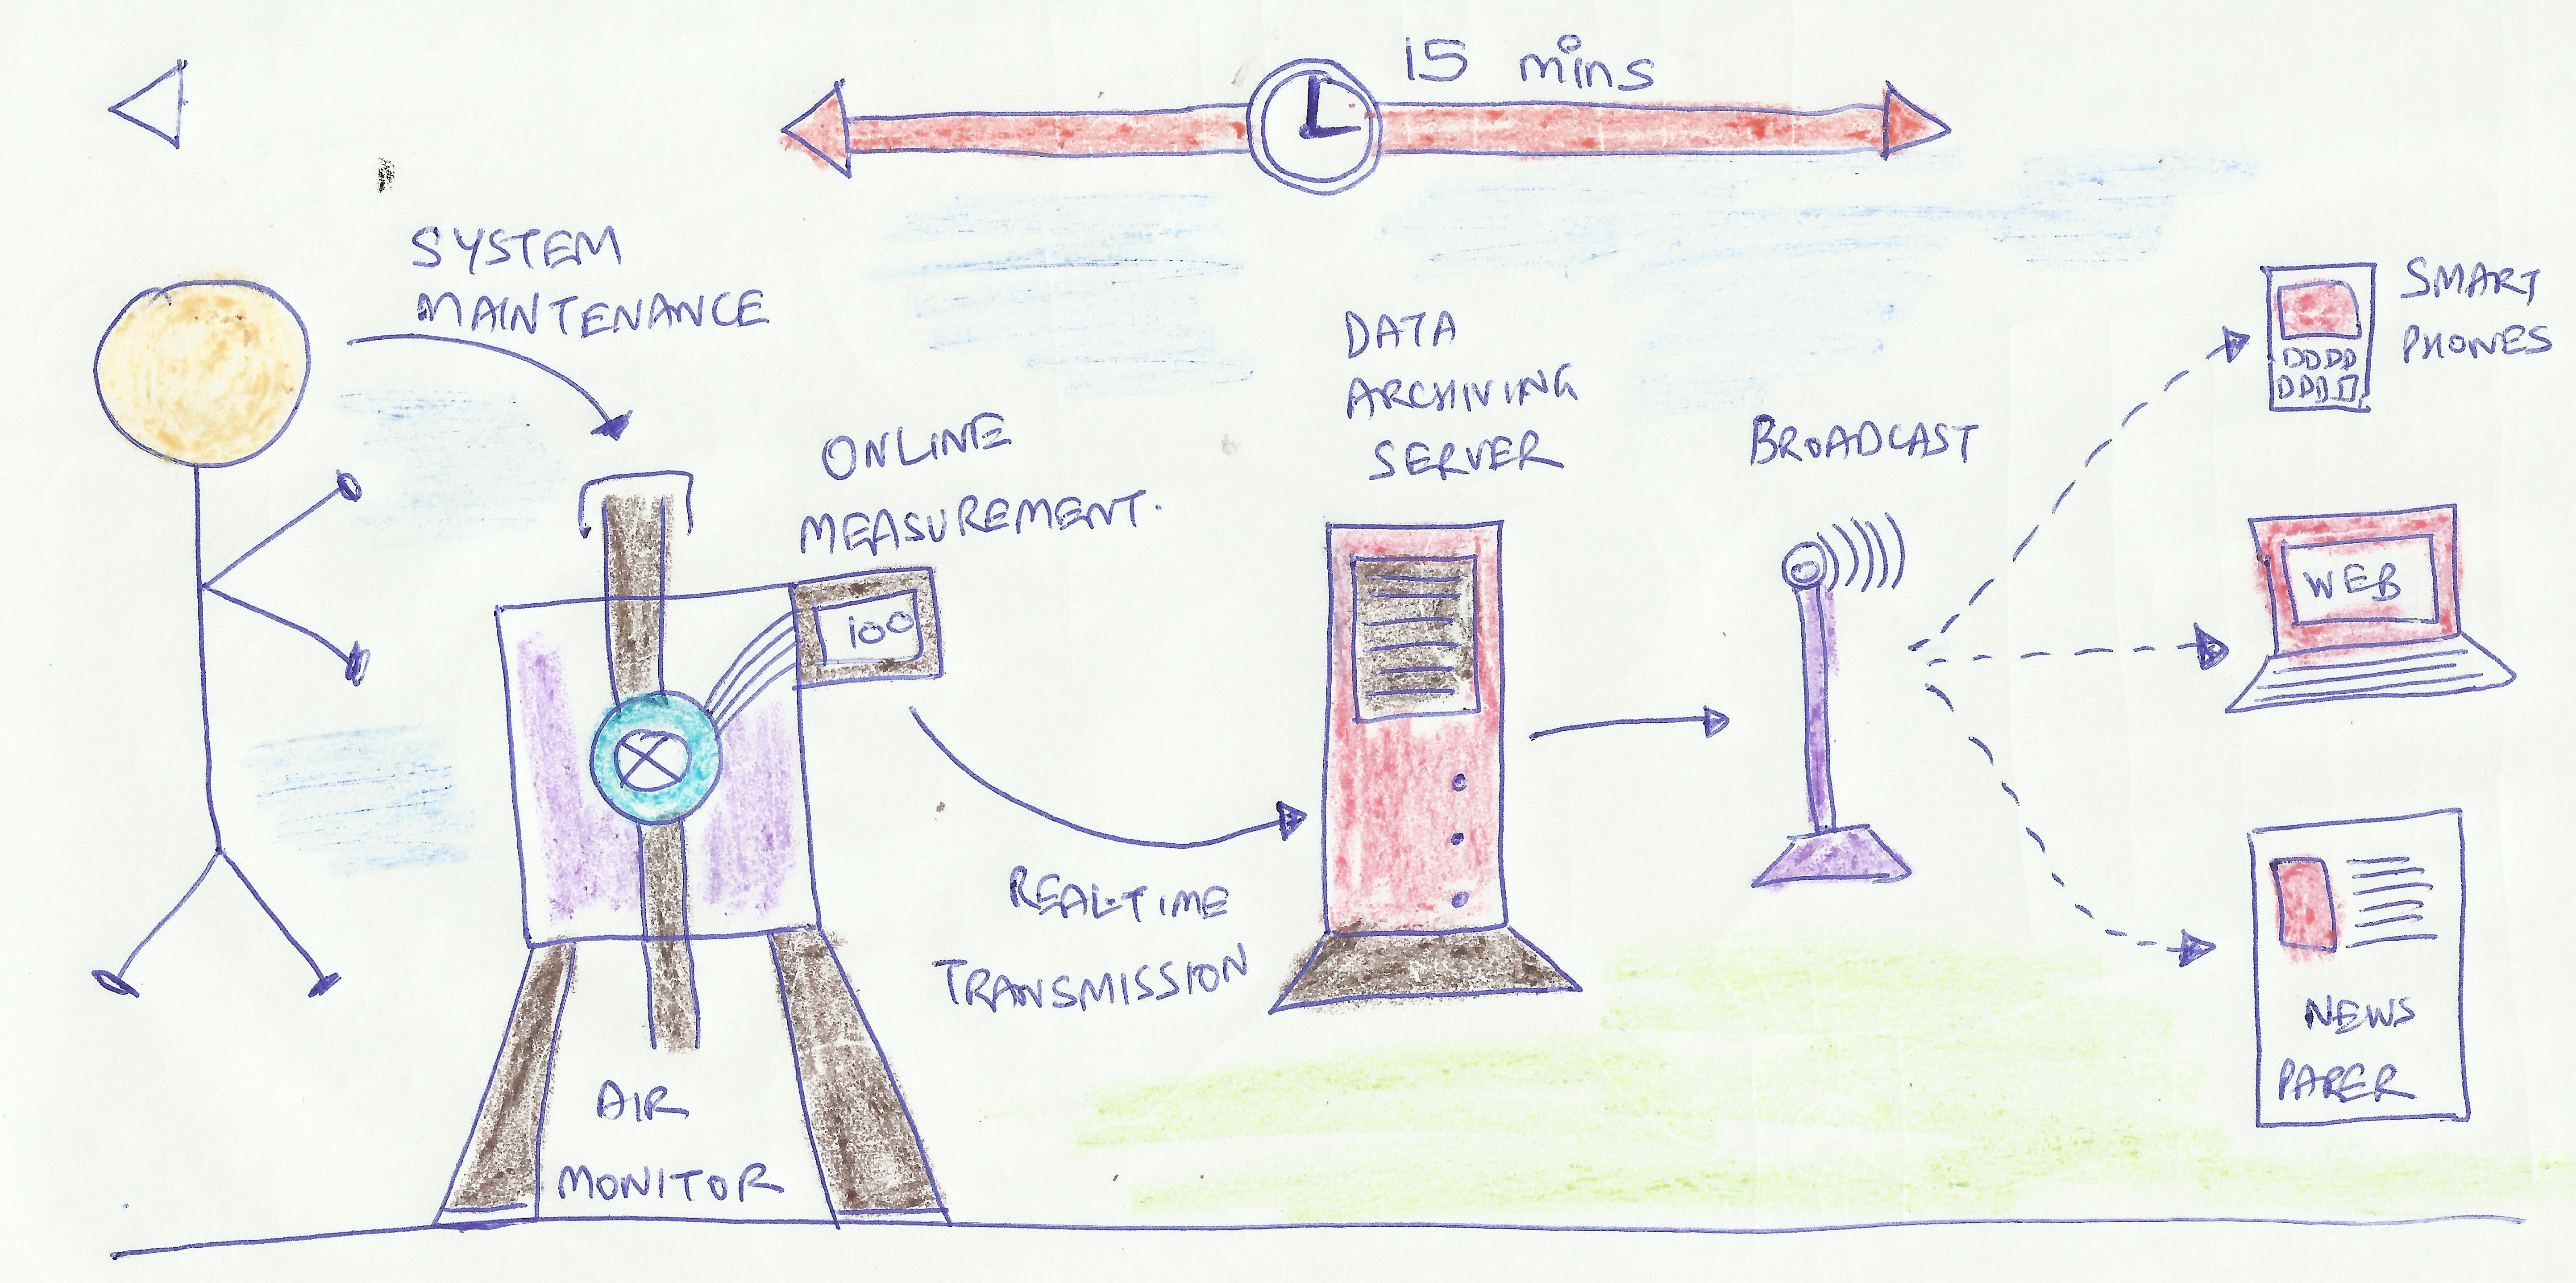
How continuous ambient air quality monitoring system worksHow manual ambient air quality monitoring system works
Ambient Monitoring
For air pollution measurements, ambient is all the air under 10m (roughly); at which point the vertical mixing is homogeneous and representative of all the sources in the vicinity (including pollution coming from long distance – neighboring village, city, state, or even country). This is a proxy for the general level of air pollution for an area. Referring to the ambient monitoring protocols proposed by the Central Pollution Control Board (CPCB, New Delhi, India), a station is to be located 3-10m from the ground and not at “ground zero”. This is to represent all source contributions at that point and not be biased by a source (at ground zero e.g., vehicle exhaust) that can influence the monitoring results – in this example case, overestimation of the pollution levels due to direct vehicle exhaust emissions.
There can also be biases associated with site selection that can influence measurements – a site that is too close to the industrial estate, or site is in the middle of the residential area, or site is obstructed by surrounding trees, or site is too close to the traffic junction, or site is in the middle of a park. To minimize these biases, the proper protocol for installing monitoring stations is that they should be off the ground (between 3 and 10 meters) and there should be multiple monitors at different sites, representing all areas of a city.
If long-term planning is the goal, then the ambient stations must run constantly over a period of time (with proper maintenance, calibration of machines, and quality control checks), so that the resulting data can provide a representative picture of spatial trends of pollution in a cities airshed, as well as provide diurnal (within the day) and seasonal (within the year) trends in air pollution levels.
A general understanding is that an ambient monitoring station can represent an area covering 2 km radius, which translates to 15 sq.km (rounded off). If the city size is 1,000 sq.km, then you need 67 stations spread across the city. In addition, we must also consider population density, the range of industrial activities, and local landuse, which will further determine the required number of stations.
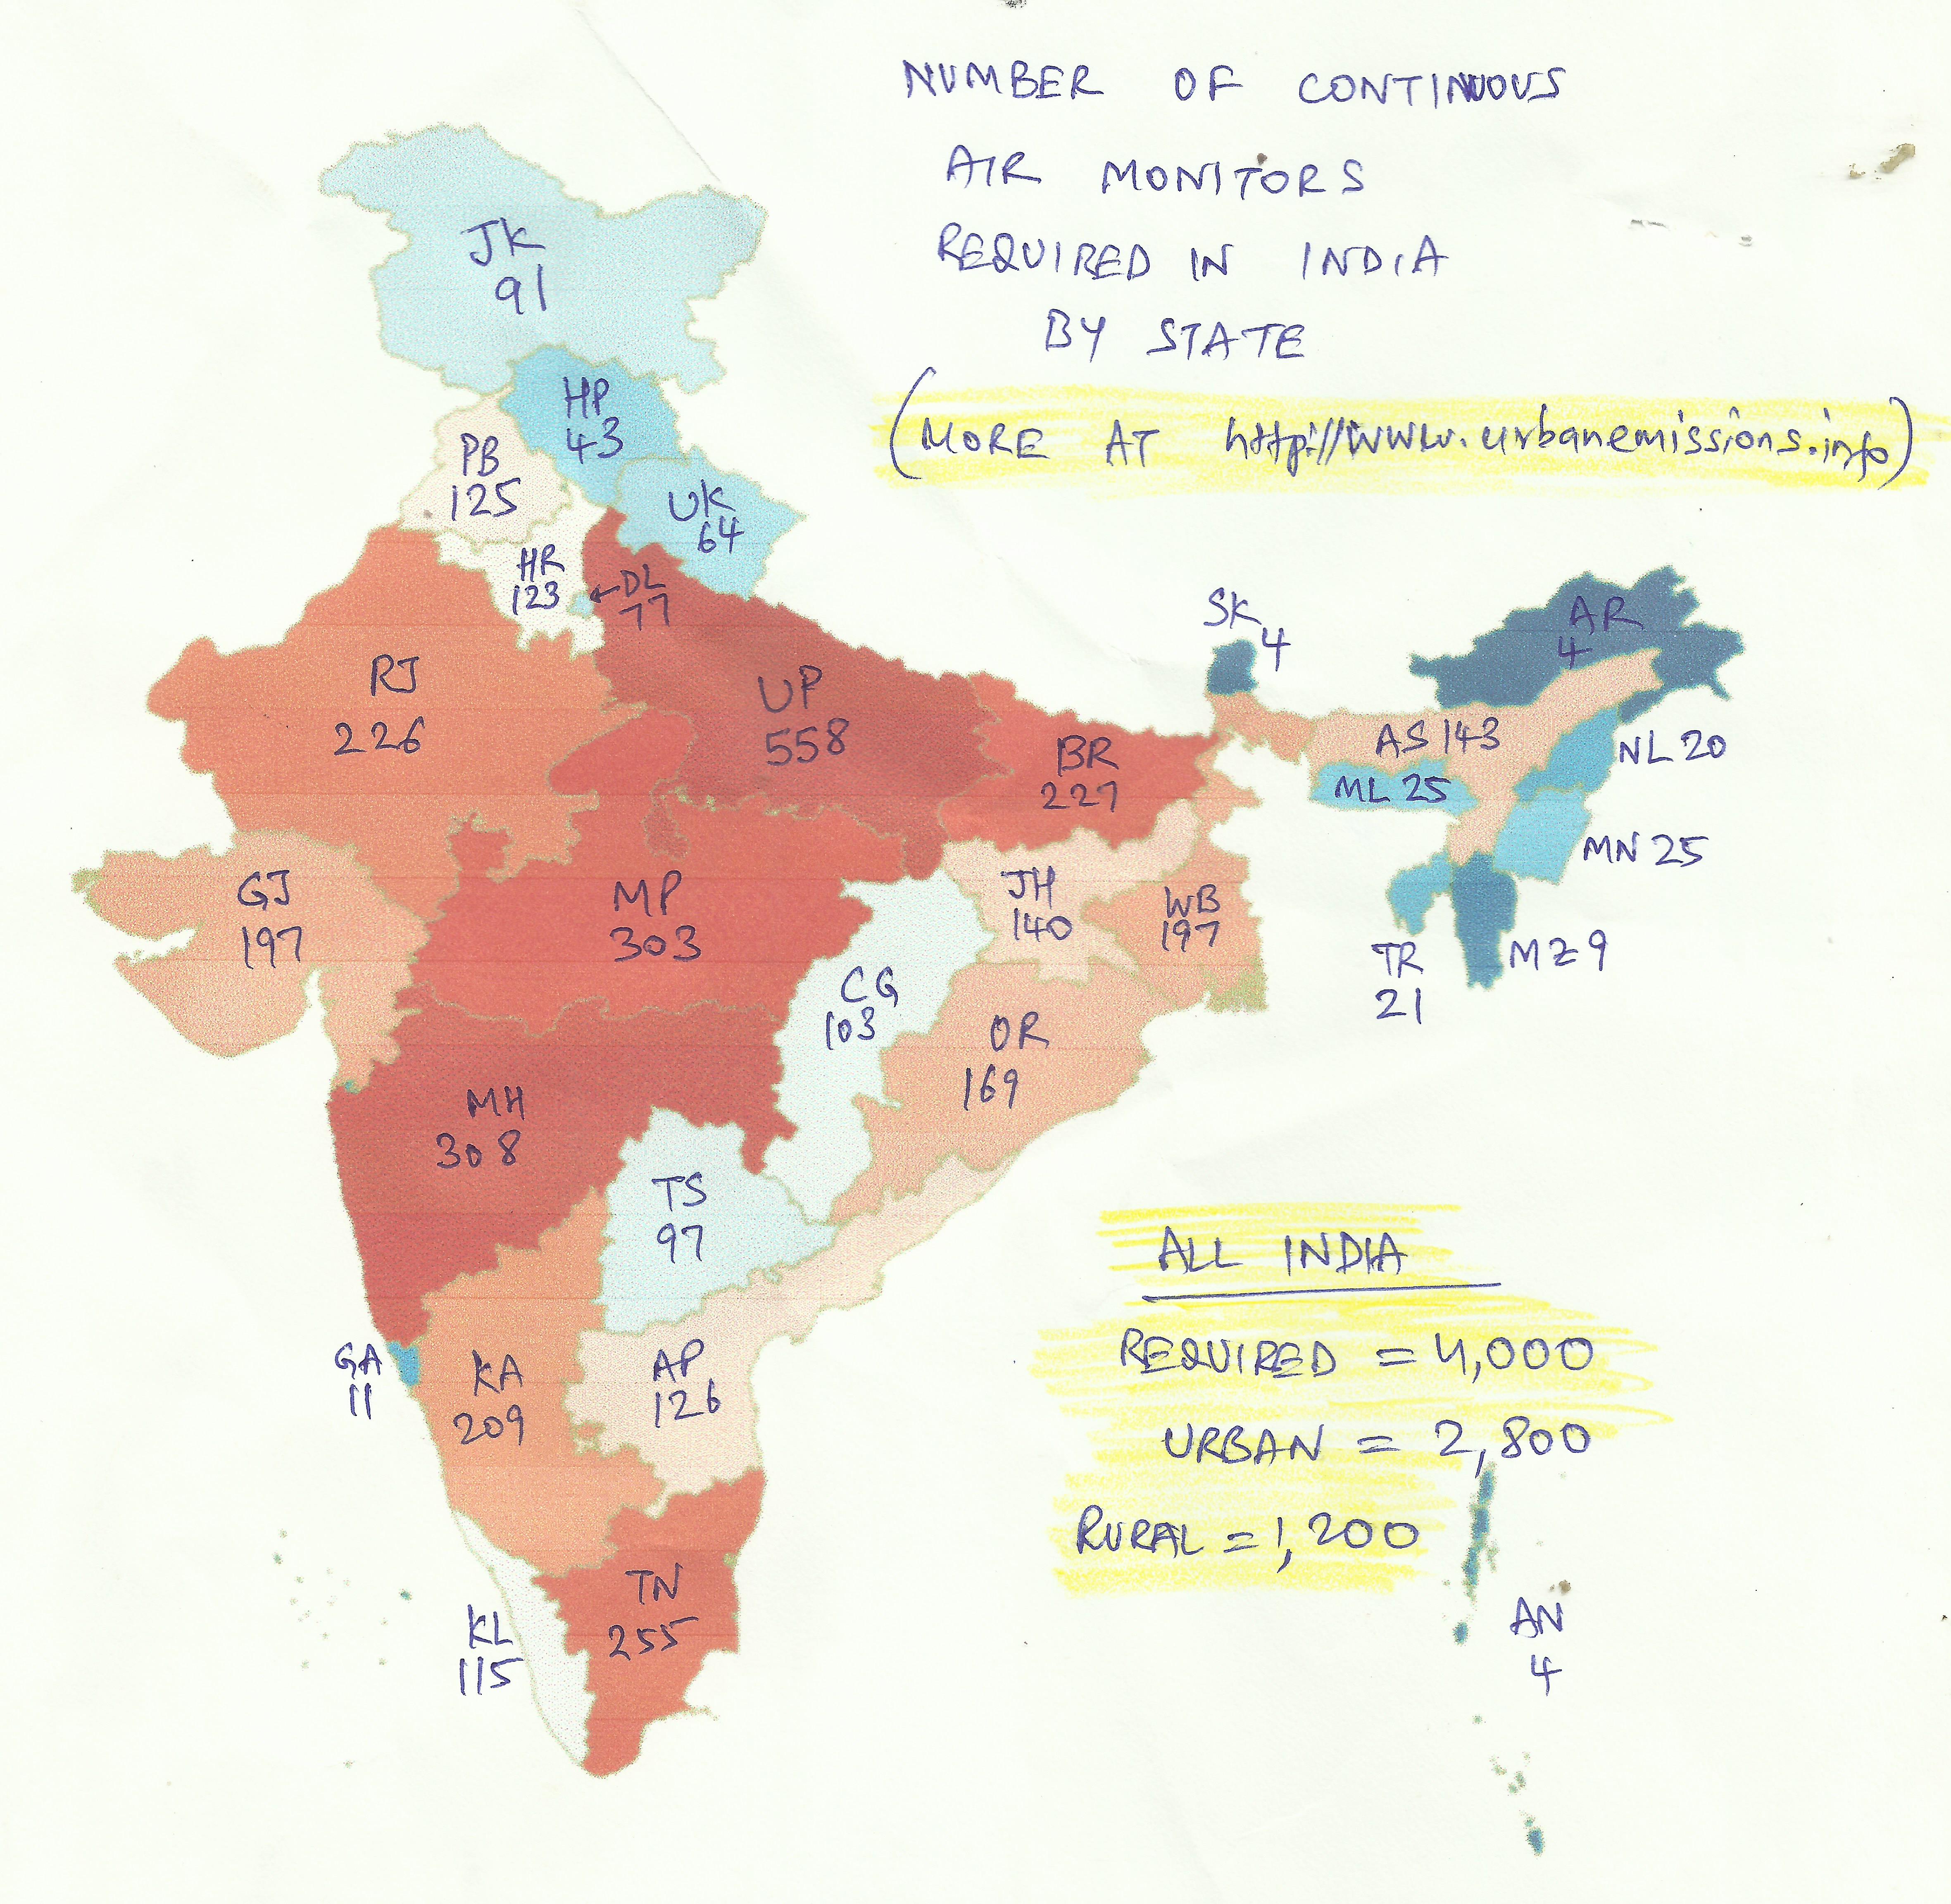
Using a thumb rule created by CPCB, which considers the total population of the airshed and the mix of activities, we estimate a need for 4,000 stations in India – 2,800 in the urban areas and 1,200 in the rural areas. Details on the number of ambient monitors required and the number of ambient monitors operational, by state and by district are available here . For example, Uttar Pradesh with a population of over 200 million requires 558 stations and Delhi with a population of over 20 million requires 77. More stations mean larger the data pool, to better understand the spatial and the temporal trends in pollution, and more support to the modeling efforts trying to understand these trends (e.g. http://www.indiaairquality.info)
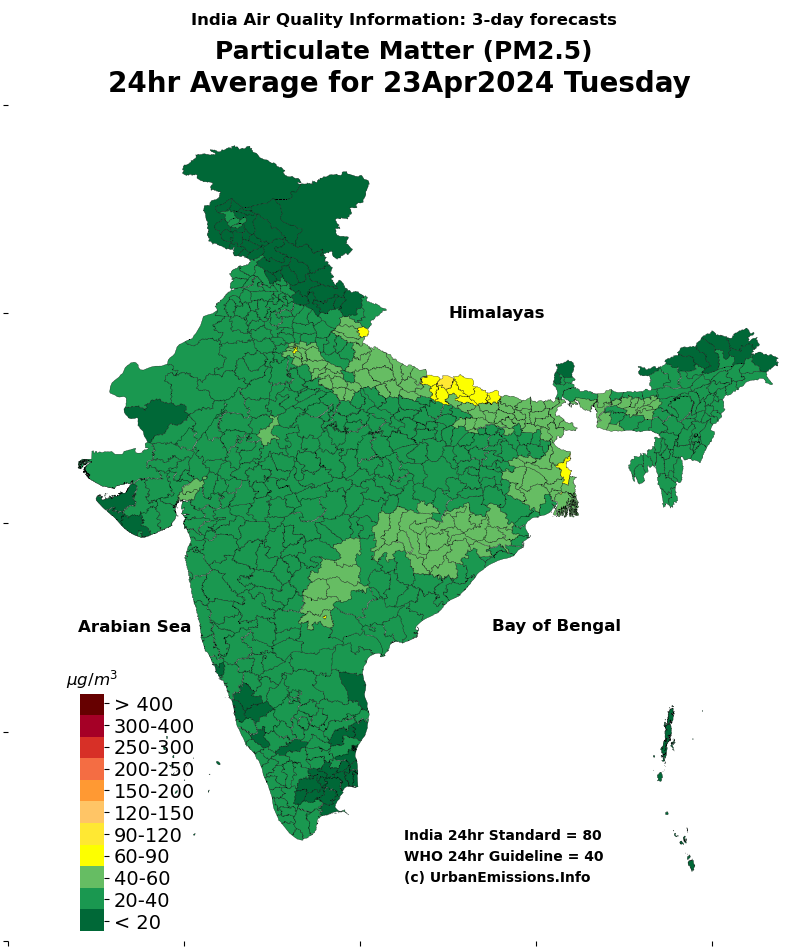
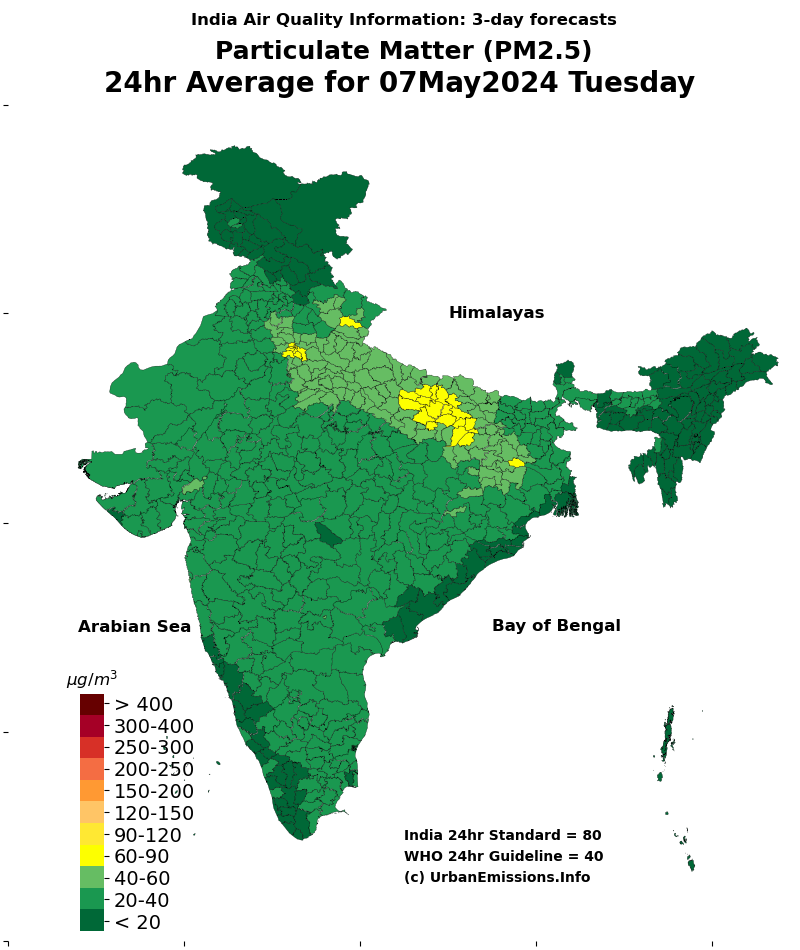
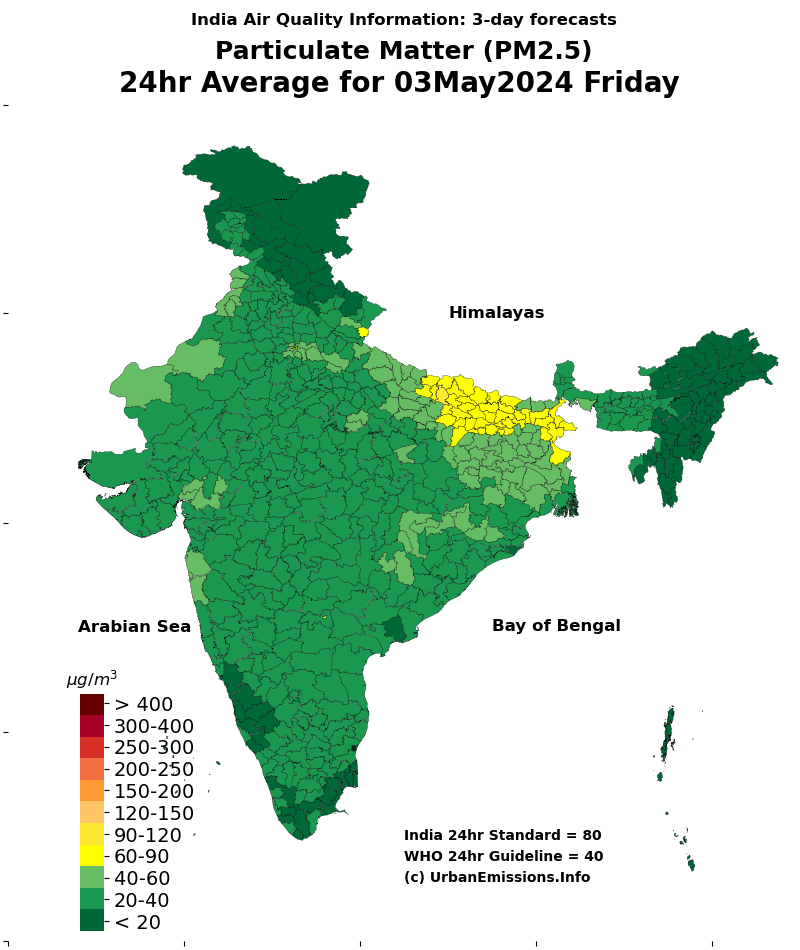
Modeled PM2.5 Concentrations (Forecast Mode)
Mobile Monitoring
When this term is used, especially by pollution control boards (PCBs), this is referring to a van equipped with the same instruments as a regulatory-grade ambient monitoring station, which when needed, is taken out, parked at the site under audit, and run for a day or a week or more, to collect ambient monitoring data for all the criteria pollutants. The flexibility of the station to relocate between sites is what makes it mobile, but the measurements taken from the unit are considered ambient, since the unit stays put, at a pre-selected spot, to take long-term measurements.
On-road Monitoring
Often in the literature, words like “on-road” and “mobile” are discussed interchangeably, referring to the fact that the measurements are conducted when the instruments are in motion. In this case, all the instruments are strapped inside (or on) the vehicle and driven to measure on-road pollution levels.
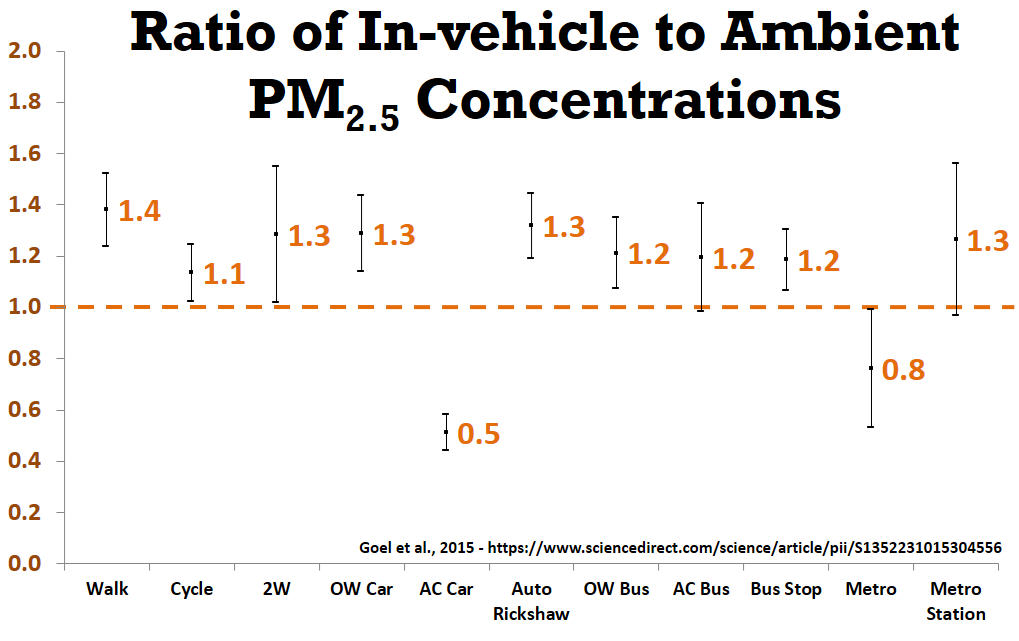
If this exercise is repeated for long periods and in multiple modes (cars, buses, cycle, motorcycle, and walking), we can establish a heat map of pollution on the roads. It is very important to note that measurements collected from this exercise are biased towards sources on the road and one land use (roads) in the city, which by design cannot be compared to the data from the ambient monitoring stations or to the ambient standards. However, this exercise is complementary, which can help create a better understanding of how much pollution travelers are exposed to.
The above graph presents a summary of exposure rates while traveling in various modes in Delhi (this study was conducted by the staff and the students at TRIPP center, Indian Institute of Technology, New Delhi, India). In simple terms, one could build a health exposure function for the urban travelers – if the city’s daily average ambient pollution is 100 μg/m3, the traveler on the roads is exposed to 20-30% more pollution (on average per day). This comparison makes sense only between averages of ambient and averages of on-road measurements.
Another example, below is a 2-min video from an on-road exposure study, presenting the highs (and lows) of PM2.5 pollution, that a traveler in an auto-rickshaw is exposed to in Delhi (click here more details on the study). You will notice that the instrument records highs of 3000 μg/m3, but these are instantaneous values that the traveler is exposed to, for 1-2 seconds, which cannot be compared to ambient monitoring data averages. This study estimated that on average a traveler in an auto-rickshaw is exposed to 50% more pollution on the roads, compared to average ambient PM2.5 levels in Delhi.
Satellite Monitoring
Satellite monitoring is a multiple step procedure that involves estimating pollution levels using a modelling exercise based on multiple assumptions. The assumptions include on-ground measurements from ambient air monitoring stations, and results of a global chemical transport model that itself is based on estimated emission inventories. Hence for accurate estimates from satellite monitoring, data from on-ground monitoring stations are crucial.
For example, NASA MODIS satellite, is the most commonly used data feed for aerosol optical depth assessments that is used to estimate global PM2.5 concentrations. This satellite orbits at 705 km and takes 99 minutes in the polar orbit to go around the earth. A newer model is ESA Sentinelseries, which orbits at 693 km. In short, we have snapshots (when the image is cloud free) of aerosol optical depth, over India, taken in a matter of seconds, to determine what the pollution levels are for that day. These snapshots tell a fascinating story, but not enough to understand the true diurnal and seasonal cycles of the on-ground pollution levels in India.
Dissecting satellite feeds, linking them to modeled data, and regressing it to on-ground concentrations, is a lengthy exercise and only a handful of groups have the technical capacity to use this methodology. Given the efforts in place to increase the ambient monitoring stations in India and the new satellites to focus on air pollutants over India (in the geostationary orbits), this methodology will get better. But today, if there is money to spend to understand air pollution in the urban and in the rural areas of India, then these efforts should be on the ground to strengthen the ambient monitoring data pool.
Emissions Monitoring
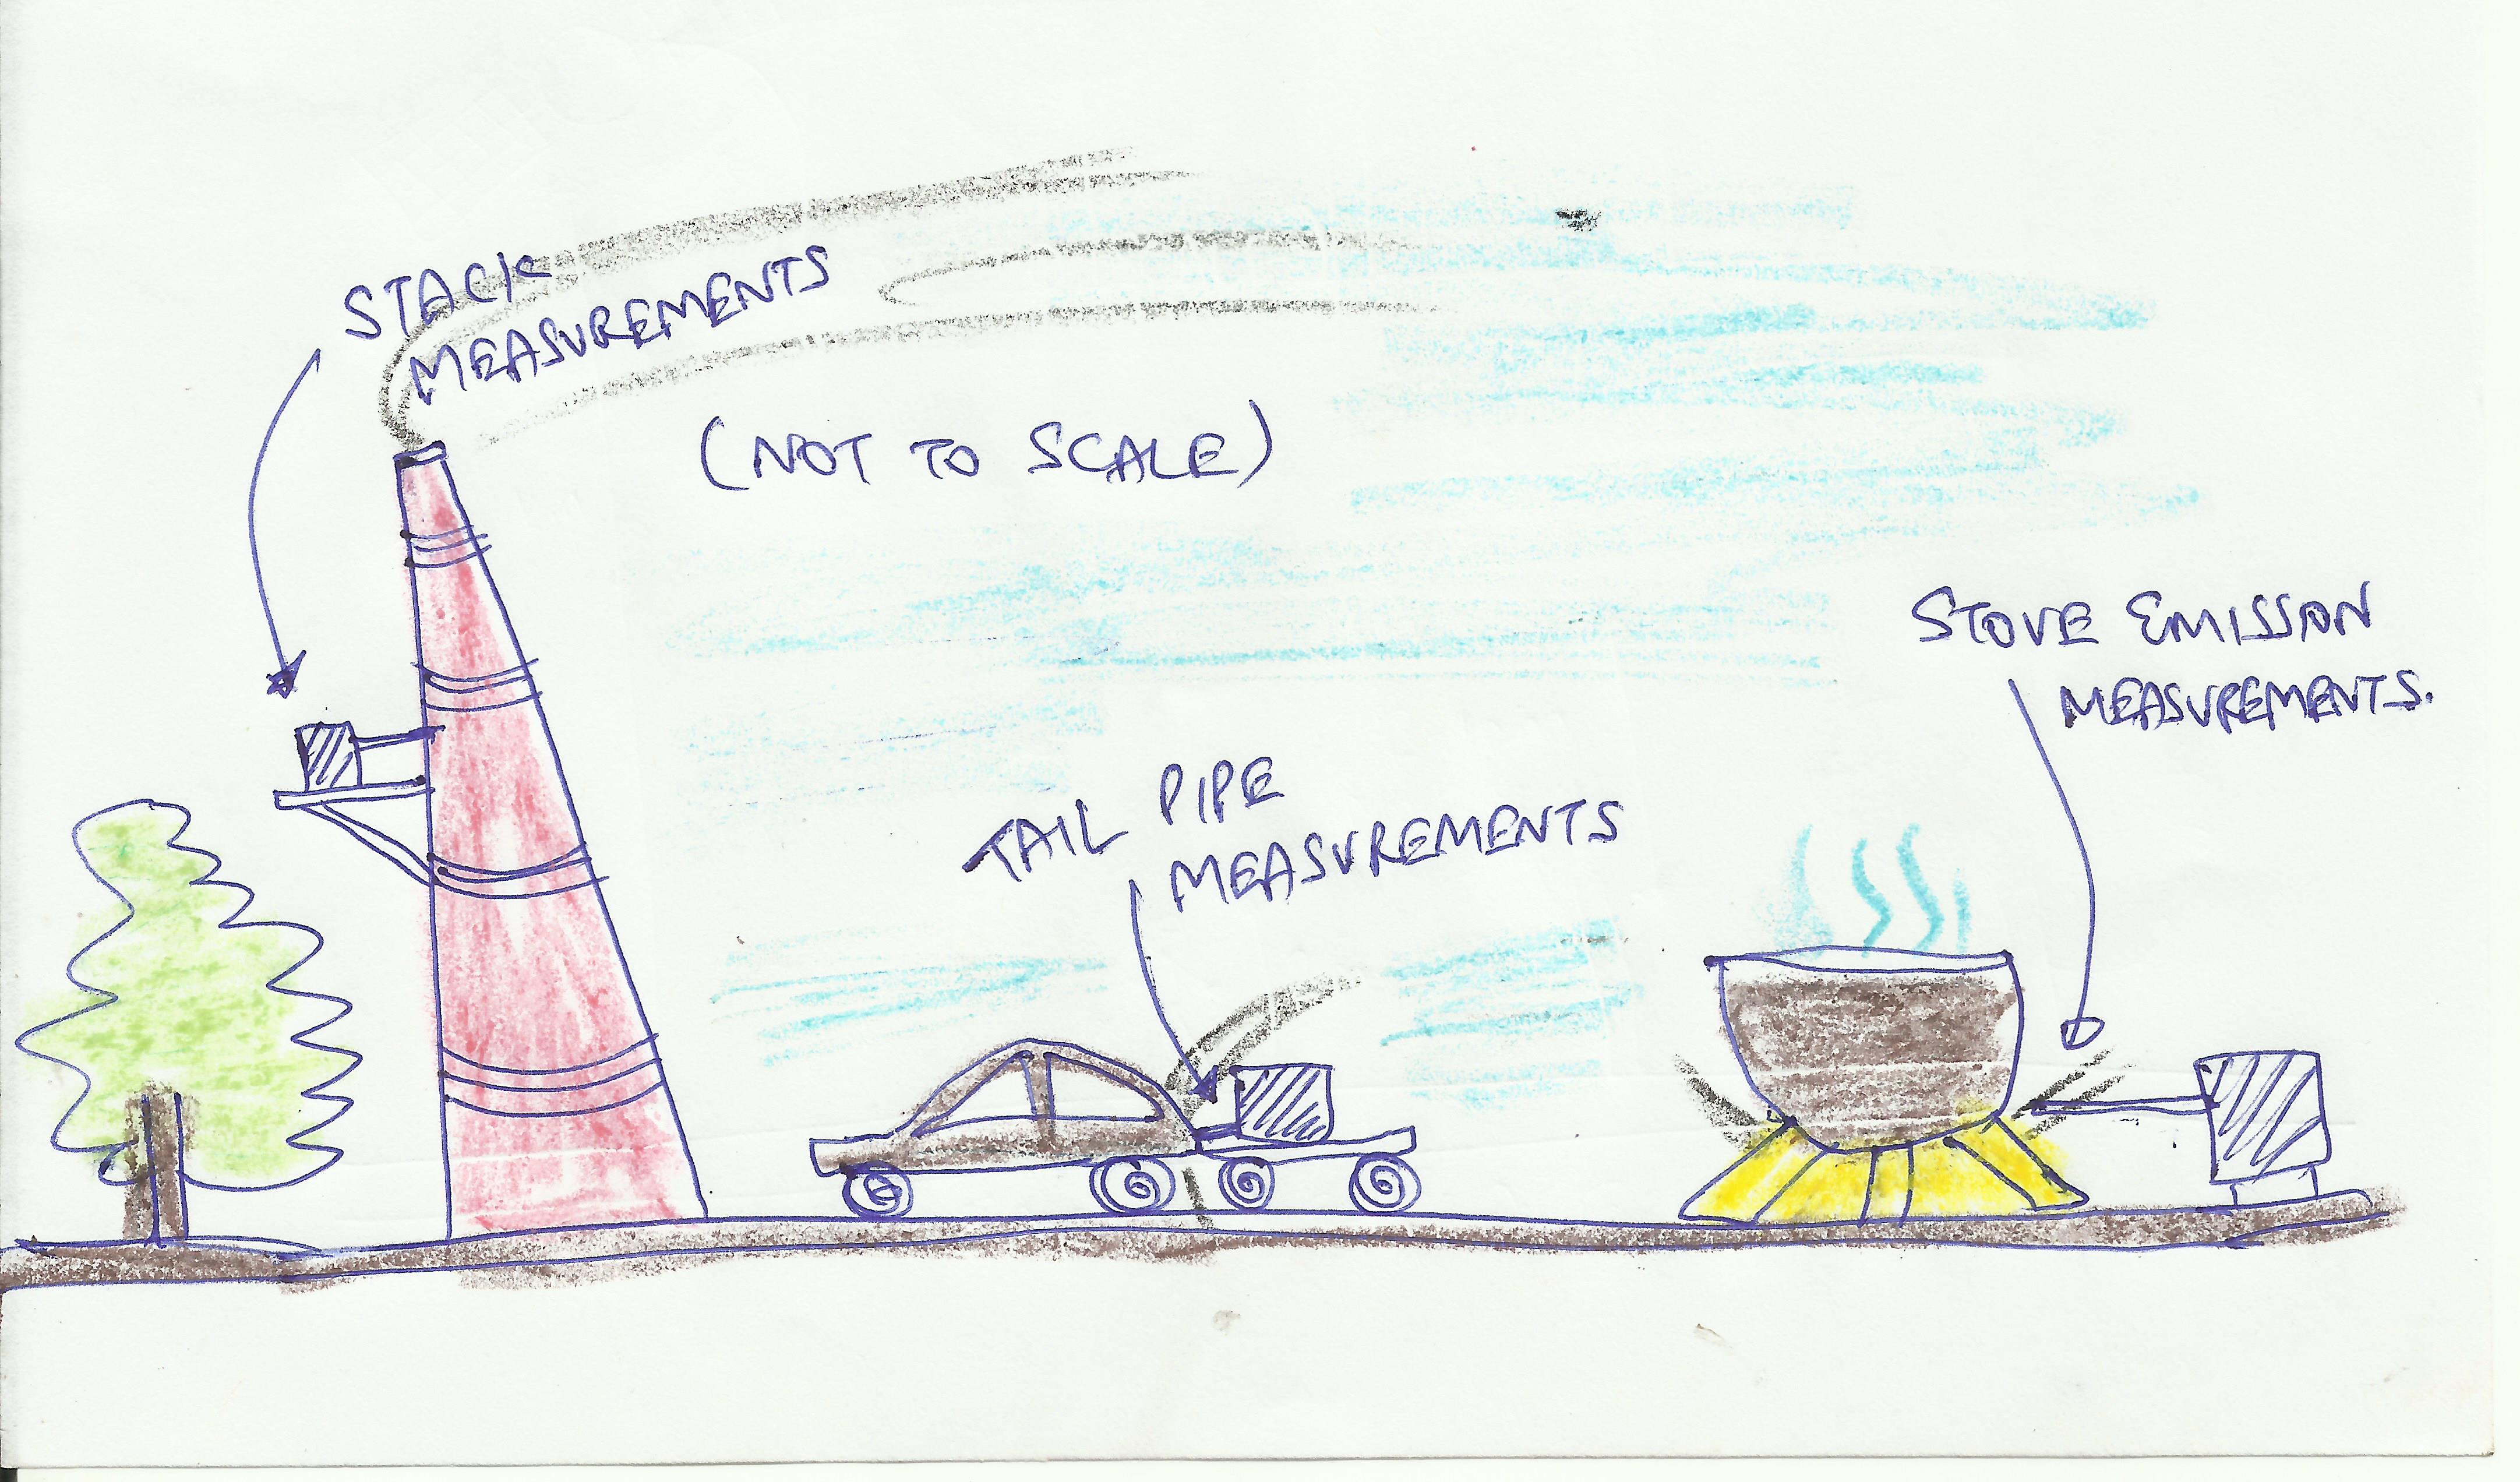
Ambient pollution is what we breathe and this should not be confused with emissions at the sources. When we stick a probe into a tailpipe or into a stack and start taking measurements, the monitor will say that the emission rate is xx g/m3 – this is an instantaneous value of emissions out of the tail pipe or the stack. Only after this amount disperses and mixes with other sources, we have an ambient air pollution value.
Like the ambient air standards, there are emission norms for most of the sectors. For example, every car, van, and jeep, gets a “pollution under control” (PUC) sticker, which means that vehicle is under the prescribed norms for that pollutant, but when you have one million vehicles running on the same roads, at the same time, the compound effect is different. Similarly for industries. Every industry is required to apply for an environmental clearance and the process does not include analysis for collective pollution loads in the industrial estate, but only for the individual plant.
There is a mandate for heavy industries to monitor air pollution at the stacks in real time. However, this information is not open for scrutiny or for use in research (for unknown reasons). Similarly, we have vehicles with Bharat-III or IV stickers (and soon Bharat VI, starting with Delhi), but the true emission rate of a vehicle is determined by its age, usage, and the roads it travels on, needs to be tested using a representative driving cycle for individual cities.
Today, most of the emission inventory work conducted for Indian cities is carried out using borrowed emission rates or constructed emission rates based on in-use technology or emissions rates adjusted for the conditions pertinent to the local activities. While we want to understand how much we are breathing and which pollutant, in order to better understand how much of that pollutant is coming from which source, we also need to invest in emissions monitoring.
Low-cost Monitoring
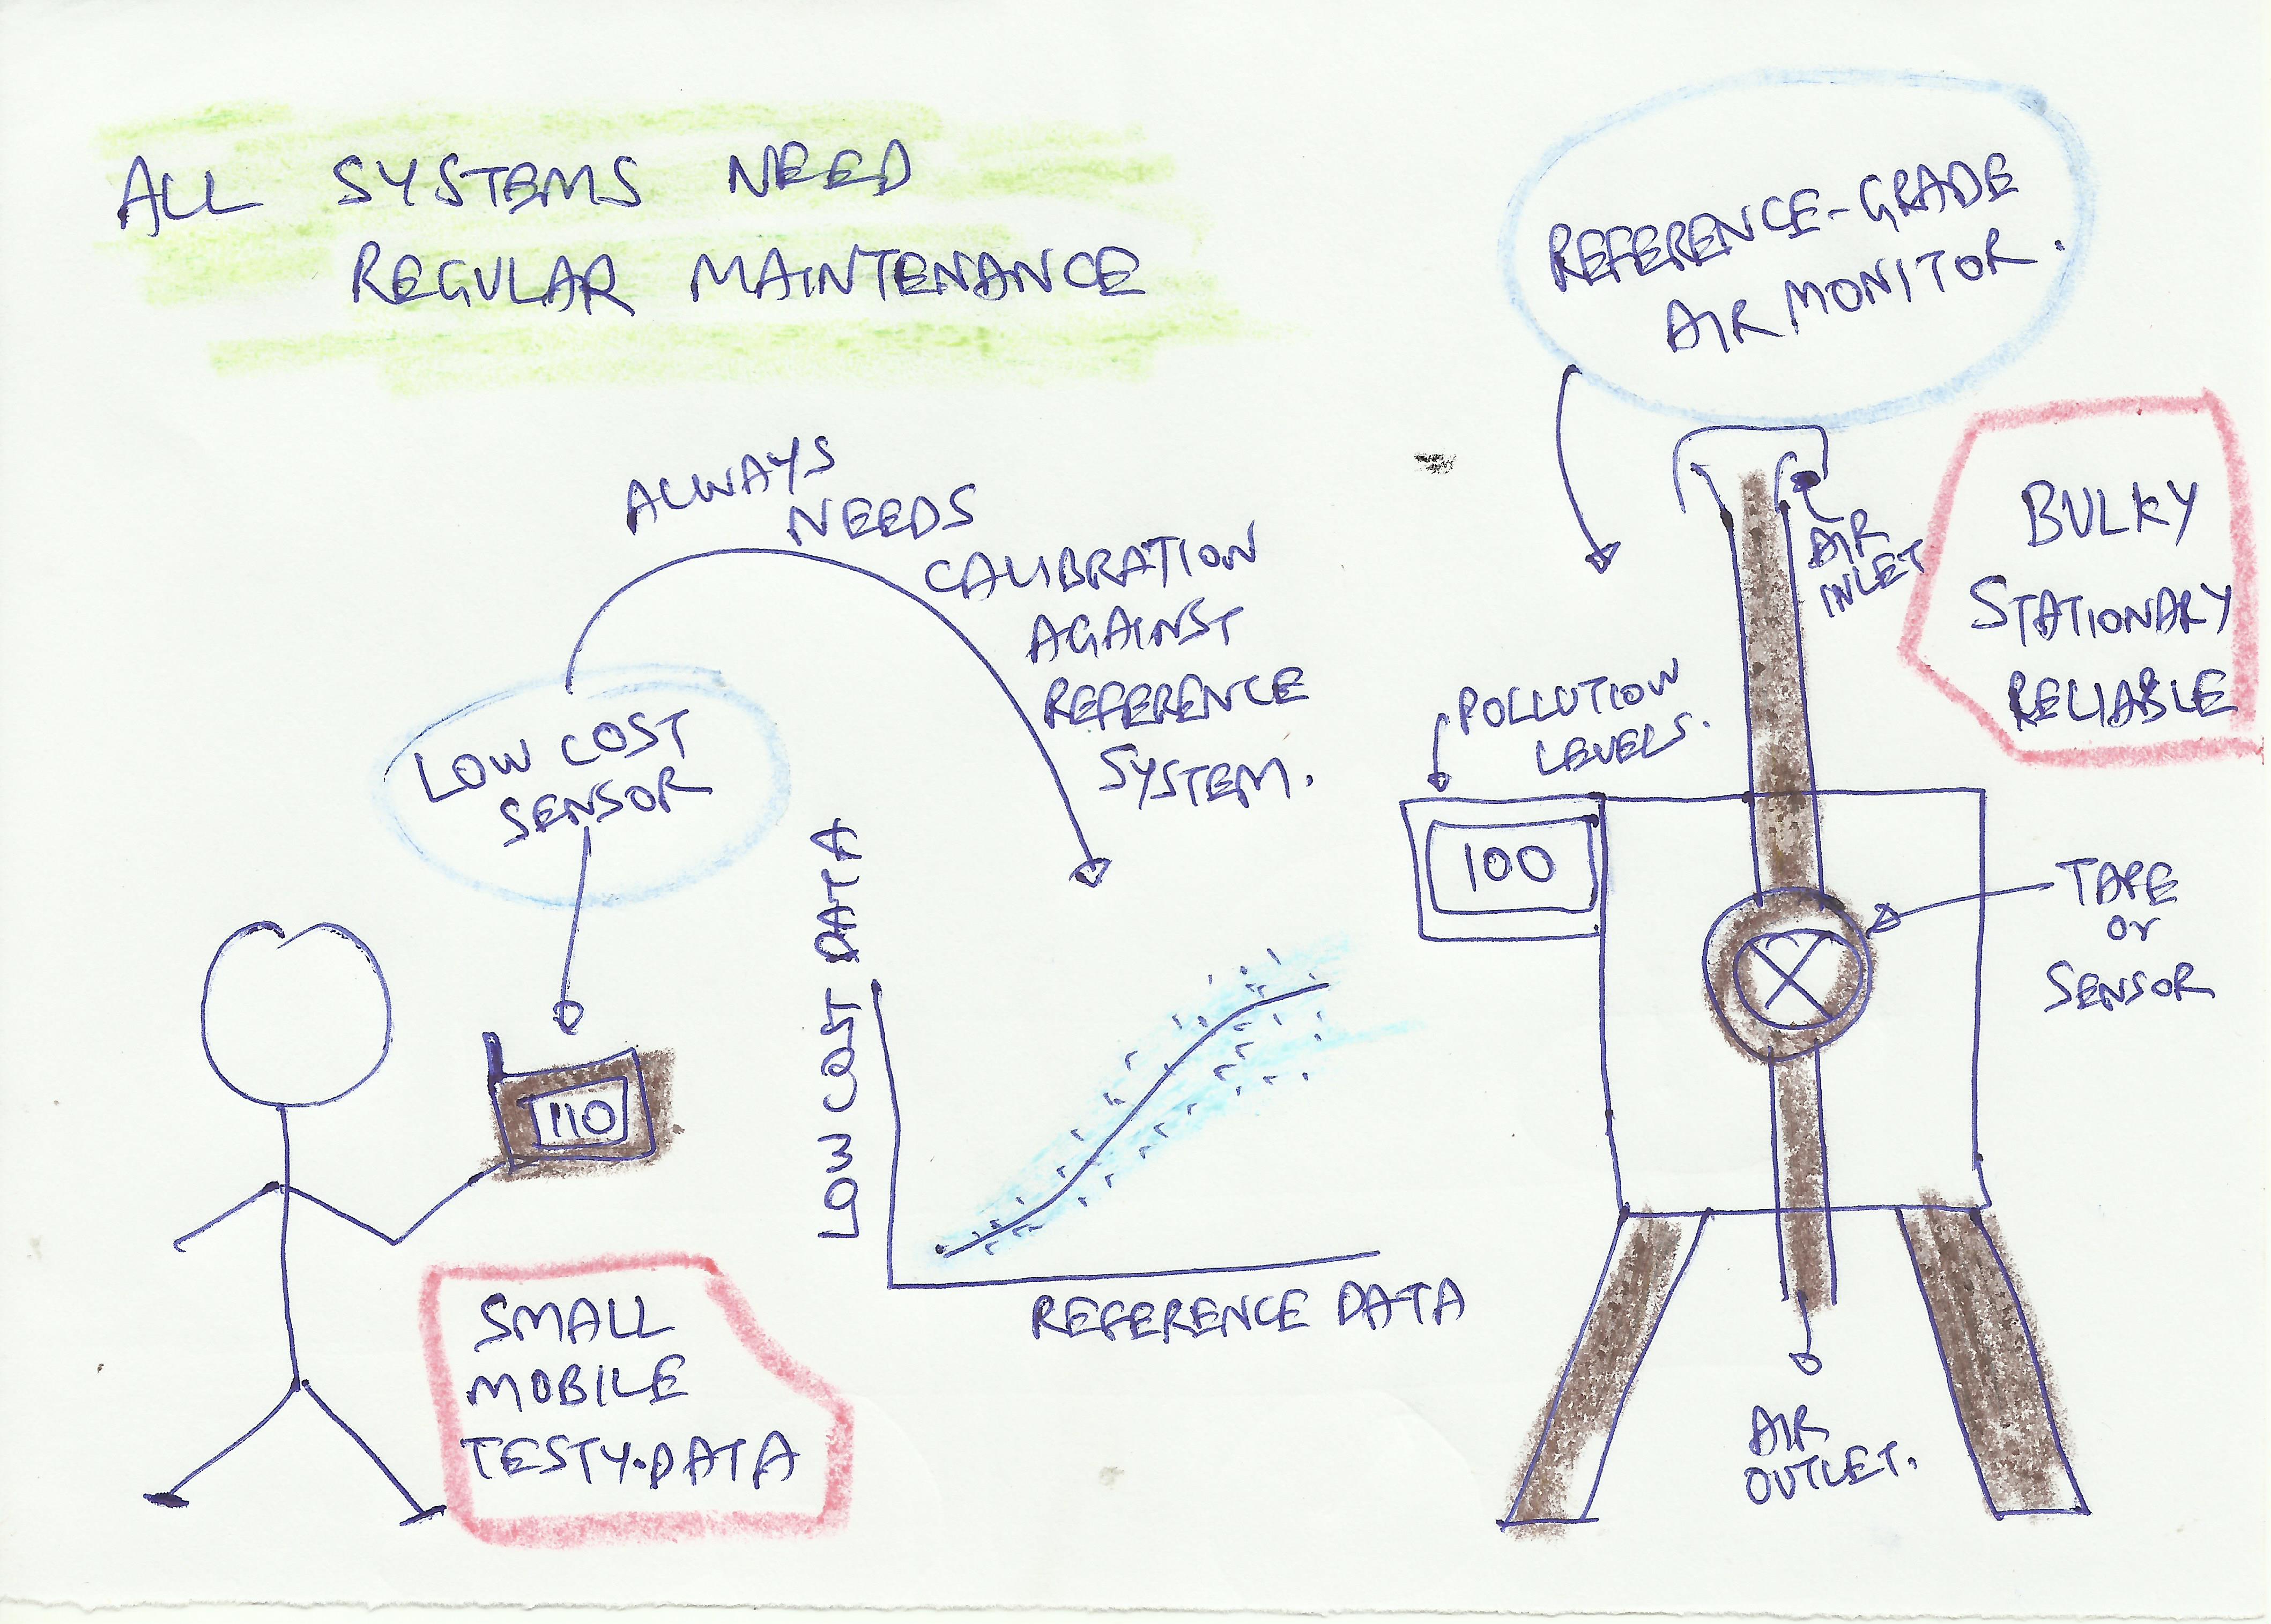
Low cost monitors have become a popular alternative to government monitoring data and has the potential to increase the pool of monitoring data. In general, these alternative sensors can help create a faster and cheaper heat map of the pollution levels in the city; can help reach the parts of the city, which are not possible to reach using standard monitors; and supplement that an expanding regulatory grade network in any city. However, if the data is meant to support long-term air quality management plans for the city, this data should be analyzed with caution, and utilized only if the equipment passes the required calibration and maintenance protocols. If un-calibrated or not used correctly, the readings will be biased and more importantly will not be accepted by policymakers as a diagnostic.
These are a fairly new development and have become especially popular because of the increases in air pollution during the winter months in north India, coupled with the fact that residents were unable to get reliable data from the government. Hence they had to resort to their own means of finding out what the air quality was (and is). Over the years, the quality of low cost monitors will improve and hopefully the government will also increase the number of monitors and provide real time access to citizens, negating the need for them to resort to their own measures.
Here are some comparisons and notes of low-cost sensors and what to look for when buying one; and one operational low-cost sensor network in India by Urban Sciences.
Using Monitoring Data
The most basic usage of monitoring data is summarized below.
Focus area
Usage
Ambient monitoring
the whole city or state or country
Data is used for long-term spatial and temporal trend analysis; can be used to determine the merits and the de-merits of an intervention over time
On-road (mobile) monitoring
confined to roads and their immediate vicinity
Data is used for understanding pollution exposure during commute; specially to understand the acute health impacts of being exposed to augmented pollution levels on the roads
Satellite monitoring
the whole city or state or country
Data is used mostly for annual scale pollution trend analysis
Emissions monitoring
a specific source
Data is used to establish the emission rate by source, by fuel, by technology, and by usage
Health impacts are the primary reason for worrying about the deteriorating air quality. One of the biggest uses of a reliable ambient air monitoring data is to establish a credible nexus with health impacts, which range from cases of ischemic heart disease (which can lead to heart attacks), cerebrovascular disease (which can lead to strokes), chronic obstructive pulmonary diseases, lower respiratory infections, and cancers (in trachea, lungs, and bronchitis). There is also a growing evidence linking air pollution with obesity, diabetes, and Alzheimer’s disease. According to the recent global burden of disease (GBD) estimates, in 2016, estimated premature deaths are 1,030,000 due to outdoor and 780,000 due to household PM2.5 pollution. Similar estimates were published by Indian researchers as well, which were categorically rejected by the Environment ministers, on multiple occasions.
The only way to better understand the impact of air pollution on our health and using it to establish an effective long-term air quality management plan, is by understand the chronic pollution exposure levels. The health impact assessments are based on long-term ambient monitoring trends and long-term hospital records. The analysis is often conducted on an annual basis for a city or a country, or for the whole globe (like the GBD work), and never for a road or for a day. The focus here is on the impacts of chronic exposure to air pollution. For example, if the city is averaging 100 μg/m3 of PM2.5 for 365 days, then the likely impact of this chronic exposure can be linked to so many premature deaths in a year due to an increase in the incidence of cardio-vascular diseases, and so on.
There are acute health impacts when exposed to high concentrations over a short period of time, such as, eye irritations, shortness of breath, inflamed sinusitis, asthma aggravation, nausea, and skin irritations; all of them have studied links to all the criteria pollutants at various levels.
Like the ambient monitoring and emissions monitoring in India, the work involved in understanding the chronic and acute health impacts on urban and rural population is lacking. The current understanding on how air pollution effects human organs, is based on studies conducted outside India. That shouldn’t be the reason to assume immunity to air pollution. More studies linking health impacts and air pollution will strengthen the case for stricter regulations and aggressive implementation of cleaner options in India, but let us not stop or wait till that happens.
World Environment Day
Celebration
Description World Environment Day is celebrated on the 5th of June every year, and is the United Nation's principal vehicle for encouraging awareness and action for the protection of our environment.
Observances: Environment Protection
Date: Wednesday, 5 June, 2019 Significance: Environmental issues awareness Also called: Eco Day, Environment Day, WED (World Environment Day) #BeatAirPollution #SNCF Here are some examples:
Use public transport or car sharing, cycle or walk Switch to a hybrid or electric vehicle and request electric taxis Turn off the car engine when stationary Reduce your consumption of meat and dairy to help cut methane emissions Compost organic food items and recycle non-organic trash Switch to high-efficiency home heating systems and equipment Save energy: turn off lights and eltronics when not in use
Choose non-toxic paints and furnishing.
Beat air pollution with this!
15 Nov
Avoid exercising outdoors when pollution levels are high. When the air is bad, walk indoors in a shopping mall or gym or use an exercise machine. Limit the amount of time your child spends playing outdoors if the air quality is unhealthy.
Always avoid exercising near high-traffic areas. Even when air quality forecasts are green, the vehicles on busy highways can create high pollution levels up to one-third mile away.
Use less energy in your home. Generating electricity and other sources of energy creates air pollution. By reducing energy use, you can help improve air quality, curb greenhouse gas emissions, encourage energy independence and save money!
Encourage your child’s school to reduce exposure to school bus emissions.
Walk, bike or carpool. Combine trips. Use buses, subways, light rail systems, commuter trains or other alternatives to driving your car.
Don’t burn wood or trash. Burning firewood and trash are among the major sources of particle pollution (soot) in many parts of the country.
Use hand-powered or electric lawn care equipment rather than gasoline-powered. Old two-stroke engines like lawnmowers and leaf or snow blowers often have no pollution control devices. They can pollute the air even more than cars, though engines sold since 2011 are cleaner.
Don’t allow anyone to smoke indoors and support measures to make all public places tobacco-free.
10 ways to beat air pollution: how effective are they?
But in the short term, what about the symptoms? We examined some of the most common solutions to see if the claims they make are anything more than hot air.
Face masks
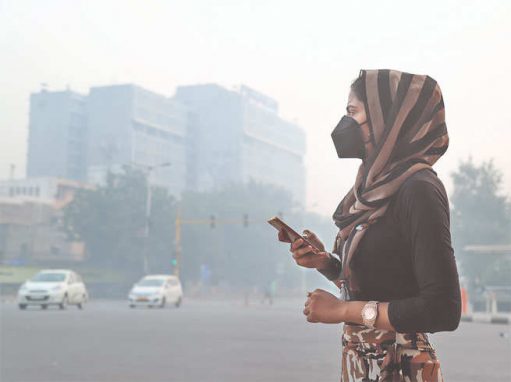
Despite looking deeply dystopian, surgeons’ masks are an increasingly common sight in cities around the world – and largely pointless, according to Prof Ally Lewis, director of the UK’s National Centre for Atmospheric Science. “Surgical masks are pretty useless because air just leaks in around the side,” Lewis says.
As for more sophisticated anti-pollution masks? “Others are designed to be far more airtight and do remove particles, but don’t remove gases. Nitrogen dioxide can pass right through.” What’s more, if the seal is good enough to keep small particles from leaking in, it may also require uncomfortable amounts of energy to suck air through the mask.
“You can conceive of extremely elaborate devices that are closer to chemical-weapons gas masks,” says Lewis, “which would filter out gases and particles – it just depends what you’re prepared to do.” His hunch is that you’d make more of an impact by changing your commuting pattern to avoid busy roads at peak times.
The humble extractor fan
Cooking can cause massive spikes in indoor air pollution, so “extractor fans are a very good idea,” says Rob MacKenzie, professor of atmospheric science at University of Birmingham, “as long as they’re venting outside – and especially if you have a gas hob, because flames produce nitrogen dioxide.”
Personal air purifiers
These come in all sizes – from take-out coffee cup to big industrial-looking drums. “If you run a big blower with a fine particle filter on it,” says Lewis, “as long as your house isn’t too leaky, it will make a meaningful difference to the particle numbers. The question regarding these products is: is the volume of air it’s filtering significant relative to the volume of the house?”
A home might cover hundreds of cubic metres, and in most houses the air is completely renewed every hour. “If your unit is the size of a drinks can,” asks Lewis, “does it seem reasonable that it is going to make its way through tonnes of air?”
A frequent complaint about the plug-in machines – which have become common domestic appliances in China – is their size. “It’s like having a rattling old air-conditioner,” says Lewis “it takes a lot of energy.”
Mark Jacobson, director of civil and environmental engineering at Stanford University, has an even more fundamental problem with the growing adoption of personal purifiers. “They are a short-term way for people to save their lungs but they do not solve air pollution problems – which also harm animals, agriculture and structures. People should not have to breathe through an air filter their entire life.”
Consumers can’t know how effectively their car filters the air they breathe. “Cars are small, sealed boxes,” says Lewis, “but they are driven in the most polluted place there is: the middle of the road. Their filters have a tough job.”
As well as most particulates, filters in modern cars should catch noxious gases such as nitrogen dioxide with charcoal. But performance will vary and filters become less effective with use – so they need replacing around every six months.
Filters should also work more efficiently, says MacKenzie, “if you limit the air exchange between inside and outside, by switching to recirculation rather than continual fresh air. It’s somewhat morally bankrupt, though, to be sitting in your luxury 4X4 with pristine air, churning out god knows what from your exhaust.”
Vehicle pollution in Guatemala City. Photograph: Rodrigo Abd/AP
Air-purifying bus shelters and street furniture are being developed, some using filters and others with added oxidation, which turns gases into dust. It sounds like a good idea, but, says Lewis, “you’ve got to think about how big the atmosphere is over a city. Hundreds and hundreds of square kilometres, possibly 2km deep, so you’ve got a massive swimming pool of pollution.”
Unless the bus stop is enclosed, like a mini-waiting room, he says, “the mixing of the atmosphere will completely outweigh the benefits you might get from blowing a bit of filtered air around.”
Underground train networks face a similar issue: “It isn’t a sealed box that you can clean up. Every time a train goes through, it’s like a piston replenishing the polluted air. You’d need machines to move thousands, maybe hundreds of thousands of tonnes of air per hour.”
Clean buildings
Advertisement
Lewis sees more gains to be had by cleaning the air in offices and other workplaces than on the streets. “A modern office building is already very air-tight for energy efficiency,” says Lewis, “so you have the opportunity to filter the air because you’re not replenishing it with polluted air from outside.”
A tree-lined street in Gothenburg. Photograph: Souvid Datta for the Guardian
“In terms of air pollution mortality and morbidity, planting trees doesn’t help very much at all,” says Jacobson. “Planting is more useful for absorbing carbon dioxide, which affects pollution indirectly through temperatures but not directly as a chemical air pollutant.” (There are, of course, many other environmental, economic and health benefits to trees – although recent guidance from National Institute for Health and Care Excellence (Nice)warned that their leaves and branches slow air currents, causing pollutants to settle, and they may also act as sinks for particulates and chemicals.)
Then again, perhaps we just haven’t been doing it right? While bunging more trees along London’s Oxford Street probably won’t touch the sides, the more leaves there are, the more fine particulates (PM10s and PM2.5s), nitrogen dioxide and carbon dioxide will be removed from the air. “You’d need two man-made filters to achieve the same effect, which would increase the energy burden,” says MacKenzie, who has a particular interest in how plants affect air.
“The most useful places to put lots of vegetation are pedestrianised areas,” he explains, “because there’s nothing there to make the air dirtier. Trees offer the advantage of closing off the area from polluted air above. And tall trees are helpful near motorways because they produce turbulence that helps traffic pollution disperse.”
Green and clean: Le Musée du quai Branly in Paris. Photograph: Alamy
Advertisement
For heavily trafficked streets, says MacKenzie, “green walls would appear, in theory, to be a better option than trees” – since the plants up the side of a building can do their job without risk of trapping pollution at street level. Their success, however, will depend on many factors.
“Green walls could help with pollution hotspots, but not with every hotspot – you have to do careful calculations,” MacKenzie explains. “It would require a lot of green vegetation, a lot of maintenance and careful, heavy implementing. So it might be an expensive solution.”
Domestic air quality monitors
Lewis co-authored an article in the scientific journal Nature last year, warning about the proliferation of unregulated, affordable air quality sensors. “Smart” sensors now even come with apps offering breakdowns of CO2, particulates and volatile organic compounds.
“There is a significant challenge in making a decent measurement of air pollution with a cheap device,” Lewis says. “The sensors may be unreliable and they are marketed at the general public, who have no way of knowing whether they’re working or not.”
By contrast, he points out, air pollution monitoring equipment used by government organisations such as Defra, or academic researchers “typically costs tens of thousands of pounds. If we had a cheap way of doing it, we’d do it the cheap way.”
Lewis advises against making health decisions based upon personal monitor readings. The most accurate guide to air quality in your home is to keep track of your local outdoor readings and to keep a close eye on possible internal sources of pollution. “If you’re constantly frying in a wok or have an open fire, you will be making additional sources [of air pollution]. It’s not rocket science, and you probably don’t need a sensor to tell you that.”
Smokeless coal can produce harmful particles. Photograph: Jake Hellbach/Alamy
MacKenzie says he finds it bizarre that, for fans of domestic open fires, “the smell is part of the attraction, when that’s telling you it’s a source of pollution”.
Advertisement
If your carbon monoxide alarm goes off when you have a fire, you should assume there are other, significant pollutants in the room’s air. “However, the threshold on an alarm is set quite high,” MacKenzie warns, “because it’s about whether you’re going to fall asleep and never wake up again. If it doesn’t go off, you might still have concentrations of carbon monoxide and other particles in your house.”
Good ventilation, dry fuel and high temperatures are essential for clean burning, while swept and lined chimneys provide further protection. Even with so-called smokeless fuel, you need to take care. “I’d estimate that smokeless coal produces more nitrogen oxides than wood fuel,” MacKenzie says, “and they both produce the very small particles that are the least noticeable, but the most harmful, of the smoke
The best - and worst - countries for air pollution and electricity use
.”
China steals an unsavory global spotlight for the thick, noxious smog that often chokes its mega-cities.
Air pollution has become so bad in Beijing, for example, that Chinese officials aim to slash its local coal consumption by 30% in 2017.
Meanwhile, the US — which currently ranks eighth on the list of countries with the lowest air pollution — could be headed in the opposite direction.
With these and other changes afoot, it's worth taking a look at current global rankings to see how China, the US, and other countries stack up when it comes to air quality, total energy use, and renewable contributions to power production.
Image: International Energy Agency/World Health Organisation (via The Eco Experts)
There are many ways to measure air pollution, but a key indicator is called "PM 2.5" — one of the most harmful classes of airborne pollutants.
The "PM" stands for "particulate matter," and the "2.5" stands for 2.5 microns in diameter or smaller — roughly the size of a single bacterium. Such pollution, as Business Insider's Lydia Ramsey explained in 2016, "is especially dangerous because it can get lodged in the lungs and cause long-term health problems like asthma and chronic lung disease."
When PM 2.5 levels go above roughly 35 micrograms per cubic meter of air, it can become a major health problem. The WHO recommends keeping PM 2.5 levels to about 10 micrograms per cubic meter.
While Chinese cities have recently hit more than 500 micrograms of PM 2.5 per cubic meter, Saudi Arabia, on a per-country average, has the most toxic air in the world.
Image: International Energy Agency/World Health Organisation (via The Eco Experts)
Image: International Energy Agency/World Health Organisation (via The Eco Experts)
Air pollution levels are one thing, but deaths attributed to them are another.
Take China, for instance. The country isn't in the top 10 for highest average levels of air pollution, in terms of PM 2.5 (Saudi Arabia wins that contest, thanks in part to its oil industry). However, it ranks fifth for having the most deaths per capita due to air pollution, in part because if its high population density.
The US currently has one of the lowest death rates attributed to air pollution.
Image: International Energy Agency/World Health Organisation (via The Eco Experts)
Image: International Energy Agency/World Health Organisation (via The Eco Experts)
Decades of scientific investigation across multiple lines of evidence corroborate a powerful yet inconvenient truth: Human-caused global warming and climate change is real, and it's briskly accelerating as we dump more carbon into the atmosphere.
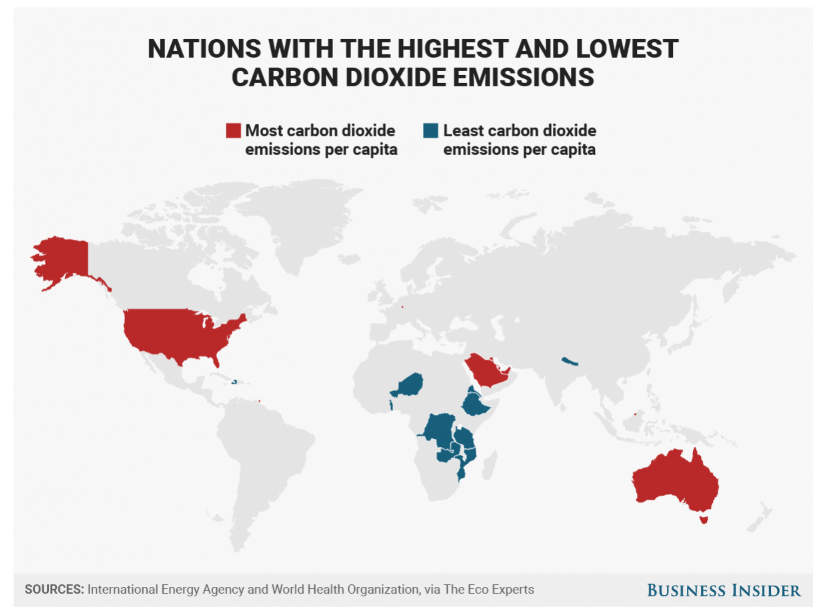
Looking at per-person average emissions of carbon dioxide, a persistent greenhouse gas emitted by burning fossil fuels, the US ranks as the eighth-highest contributor in the world.
Less developed nations, which lack robust and power-hungry infrastructure, rank among the lowest contributors to carbon dioxide emissions.
Image: International Energy Agency/World Health Organisation (via The Eco Experts)
Image: International Energy Agency/World Health Organisation (via The Eco Experts)
The main reason the US ranks so poorly on carbon dioxide emissions is because its per-person consumption rate of electricity is so high; all of that energy comes primarily from fossil fuels.
As with carbon dioxide emission rankings, less developed nations tend to score better on electricity consumption because access to electrical power is not as widely available.
Image: International Energy Agency/World Health Organisation (via The Eco Experts)








 .”
.”