Tuesday, 24 November 2020

Friday, 20 November 2020
40 WAYS TO BETTER HEALTH IN 2020 -21
40 WAYS TO BETTER HEALTH IN 2020 -21
1. Drink plenty of water.
2. Eat breakfast like a king, lunch like a prince and dinner like a beggar.
3. Eat more foods that grow on trees and plants, and eat less food that is manufactured in plants.
4. Live with the 3 E’s — Energy, Enthusiasm, and Empathy.
5. Make time for prayer and reflection
6. Play more games.
7. Read more books than you did in 2019-20
8. Sit in silence for at least 10 minutes each day.
9. Sleep for at least 7 hours.
Personality:
10. Take a 10-30 minutes walk every day —- and while you walk, smile.
11. Don’t compare your life to others’. You have no idea what their journey is all about.
12. Don’t have negative thoughts or things you cannot control. Instead invest your energy in the positive present moment.
13. Don’t over do; keep your limits.
14. Don’t take yourself so seriously; no one else does.
15. Don’t waste your precious energy on gossip.
16. Dream more while you are awake.
17. Envy is a waste of time. You already have all you need.
18. Forget issues of the past. Don’t remind your partner with his/her mistakes of the past. That will ruin your present happiness.
19. Life is too short to waste time hating anyone. Don’t hate others.
20. Make peace with your past so it won’t spoil the present.
21. No one is in charge of your happiness except you.
22. Realize that life is a school and you are here to learn. Problems are simply part of the curriculum that appear and fade away like algebra class but the lessons you learn will last a lifetime.
23. Smile and laugh more.
24. You don’t have to win every argument. Agree to disagree.
Community:
25. Call your family often.
26. Each day give something good to others.
27. Forgive everyone for everything.
28. Spend time with people over the age of 70&under the age of 6.
29. Try to make at least three people smile each day.
30. What other people think of you is none of your business.
31. Your job won’t take care of you when youare sick. Your family and friends will. Stay in touch.
Life:
32. Do the right things.
33. Get rid of anything that isn’t useful, beautiful or joyful.
34. Forgiveness heals everything.
35. However good or bad a situation is, it will change.
36. No matter how you feel, get up, dress up and show up.
37. The best is yet to come.
38. When you awake alive in the morning, don’t take it for granted – embrace life.
39. Your inner most is always happy. So, be happy and ENJOY LIFE!
Last but not least:
40. Grow your relationship with God
2. Eat breakfast like a king, lunch like a prince and dinner like a beggar.
3. Eat more foods that grow on trees and plants, and eat less food that is manufactured in plants.
4. Live with the 3 E’s — Energy, Enthusiasm, and Empathy.
5. Make time for prayer and reflection
6. Play more games.
7. Read more books than you did in 2019-20
8. Sit in silence for at least 10 minutes each day.
9. Sleep for at least 7 hours.
Personality:
10. Take a 10-30 minutes walk every day —- and while you walk, smile.
11. Don’t compare your life to others’. You have no idea what their journey is all about.
12. Don’t have negative thoughts or things you cannot control. Instead invest your energy in the positive present moment.
13. Don’t over do; keep your limits.
14. Don’t take yourself so seriously; no one else does.
15. Don’t waste your precious energy on gossip.
16. Dream more while you are awake.
17. Envy is a waste of time. You already have all you need.
18. Forget issues of the past. Don’t remind your partner with his/her mistakes of the past. That will ruin your present happiness.
19. Life is too short to waste time hating anyone. Don’t hate others.
20. Make peace with your past so it won’t spoil the present.
21. No one is in charge of your happiness except you.
22. Realize that life is a school and you are here to learn. Problems are simply part of the curriculum that appear and fade away like algebra class but the lessons you learn will last a lifetime.
23. Smile and laugh more.
24. You don’t have to win every argument. Agree to disagree.
Community:
25. Call your family often.
26. Each day give something good to others.
27. Forgive everyone for everything.
28. Spend time with people over the age of 70&under the age of 6.
29. Try to make at least three people smile each day.
30. What other people think of you is none of your business.
31. Your job won’t take care of you when youare sick. Your family and friends will. Stay in touch.
Life:
32. Do the right things.
33. Get rid of anything that isn’t useful, beautiful or joyful.
34. Forgiveness heals everything.
35. However good or bad a situation is, it will change.
36. No matter how you feel, get up, dress up and show up.
37. The best is yet to come.
38. When you awake alive in the morning, don’t take it for granted – embrace life.
39. Your inner most is always happy. So, be happy and ENJOY LIFE!
Last but not least:
40. Grow your relationship with God
Wednesday, 18 November 2020
Source apportionment studies
QUALITY MONITORING, EMISSION INVENTORY AND SOURCE APPORTIONMENT STUDIES FOR INDIAN CITIES
Ambient air quality monitoring carried out at various cities/towns in the country, under National Air Monitoring Programme (NAMP) provide air quality data that form the basis for identification of areas with high air pollution levels and in planning the strategies & development of action plans for control & abatement of air pollution. Data generated over the years reveal that particulate matter (SPM & RSPM) are exceeding more than the permissible levels at many locations, particularly in urban areas. Air pollution problem becomes complex due to multiplicity and complexity of air polluting sources (e.g. industries, automobiles, generator sets, domestic fuel burning, road side dusts, construction activities, etc.). A cost-effective approach for improving air quality in polluted areas involves (i) identification of emission sources; (ii) assessment of extent of contribution of these sources on ambient environment; (iii) prioritizing the sources that need to be tackled; (iv) evaluate various options for controlling the sources with regard to feasibility and economic viability; and (v) formulation and implementation of most appropriate action plans. Source apportionment study, which is primarily based on measurements and tracking down the sources through receptor modeling, helps in identifying the sources & extent of their contribution. The Auto Fuel Policy document of Government of India also recommended for carrying out source apportionment studies.
Accordingly, source apportionment studies have been initiated in six major cities viz. (i) Delhi ; (ii) Mumbai; (iii) Chennai; (iv) Bangalore ; (v) Pune; and (vi) Kanpur. The study would focus on apportionment of fine particulates (PM 10 & PM 2.5 ), being most critical. Besides, separate projects on Development of emission factors for vehicles and Development of emission profiles for vehicular as well as non-vehicular sources have also been taken up, which would provide necessary inputs to source apportionment studies. Details of the projects, executing institutes and approximate costs are as follow:
| Project | Institute |
| SA for Delhi | NEERI |
| SA for Bangalore | TERI |
| SA for Pune | ARAI |
| SA for Mumbai | NEERI |
| SA for Chennai | IITM |
| SA for Kanpur | IITK |
| EF for Vehicles | ARAI |
| SP (vehicles) | ARAI |
| SP (other sources) | IITB and NEERI |
The scope for source apportionment studies includes preparation of emission inventories, monitoring of ambient air quality for various pollutants (SPM, PM 10 , PM 2.5 , SO2 , NO x , CO, HC, VOC, etc.) at selected locations (07 – 10 locations covering different land use viz. residential, industrial, kerbside, background, etc.), chemical speciation of PM 10 & PM 2.5 as well as source emissions, application of receptor (CMB8) & dispersion models to assess the contribution from various sources, future projections and evaluation of various control options to develop cost-effective action plans.
Documents for reference
- NATIONAL SUMMARY REPORT
- CITY SPECIFIC REPORTS
- BANGALORE
- CHENNAI
- DELHI
- KANPUR
- MUMBAI
- MUMBAI ANNEXURES
- PUNE
- CONCEPTUAL GUIDELINES AND COMMON METHODOLOGY
- MODEL STANDARD OPERATING PROCEDURES (SOPs) FOR SAMPLING AND ANALYSIS
- REPORT ON EMISSION FACTOR DEVELOPMENT FOR INDIAN VEHICLES
- REPORT ON SOURCE PROFILING FOR VEHICULAR SOURCES
- REPORT ON SOURCE PROFILING FOR VEHICULAR SOURCES
- VEHICULAR SOURCES EMMISSION PROFILES
- REPORT ON SOURCE PROFILING FOR STATIONARY SOURCES
- VOLUME 1
- VOLUME 2
- STATIONARY SOURCES EMISSION PROFILES
Friday, 13 November 2020
Local Weather Report and Forecast For: Kakinada Dated :Nov 13, 2020
|
||||||||||||||||||||||||||||||||||||||||||||||
|
||||||||||||||||||||||||||||||||||||||||||||||


Saturday, 7 November 2020
MSP Operations during Kharif Marketing Season 2020-21
MSP Operations during Kharif Marketing Season 2020-21
Posted On:
07 NOV 2020 4:13PM by PIB Delhi
In the ongoing Kharif Marketing Season (KMS) 2020-21, Government continues to procure Kharif 2020-21 crops at its MSP from farmers as per its existing MSP Schemes.
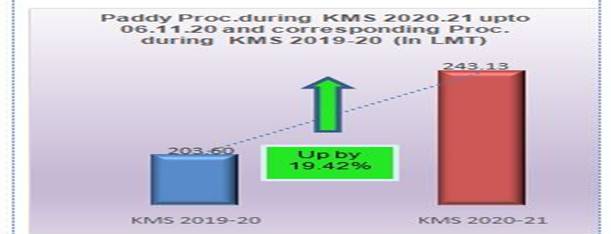
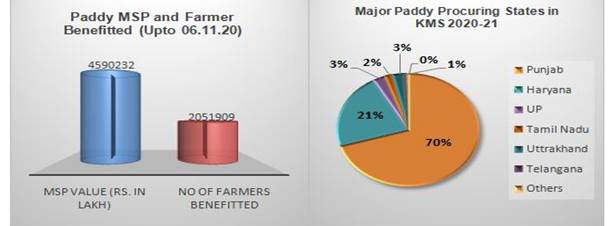
Paddy procurement for Kharif 2020-21 is continuing smoothly in the procuring States & UTs of Punjab, Haryana, Uttar Pradesh, Telangana, Uttarakhand, Tamil Nadu, Chandigarh, Jammu & Kashmir, Kerala, Gujarat and Andhra Pradesh with purchase of over 243.13 LMTs of paddy upto 06.11.2020 against the last year corresponding purchase of 203.60 LMT showing an increase of 19.42 % over last year. Out of the total purchase of 243.13 LMT, Punjab alone has contributed 171.09 LMT which is 70.37 % of total procurement.
About 20.51 Lac farmers have already been benefitted from the ongoing KMS procurement Operations with MSP value of Rs. 45902.32 Crore.
Further, based on the proposal from the States, approval was accorded for procurement of 45.10 LMT of Pulse and Oilseeds of Kharif Marketing Season 2020 for the States of Tamil Nadu, Karnataka, Maharashtra, Telangana, Gujarat, Haryana, Uttar Pradesh, Odisha, Rajasthan and Andhra Pradesh under Price Support Scheme(PSS). Further, sanction for procurement of 1.23 LMT of Copra (the perennial crop)for the States of Andhra Pradesh, Karnataka, Tamil Nadu and Kerala was also given. For other States/UTs, approval will also be accorded on receipt of proposals for procurement of Pulses, Oilseeds and Copra under PSS so that procurement of FAQ grade of these crops can be made at notified MSP for the year 2020-21 directly from the registered farmers, if the market rate goes below MSP during the notified harvesting period in the respective States/UTs by the Central Nodal Agencies through State nominated procuring agencies.
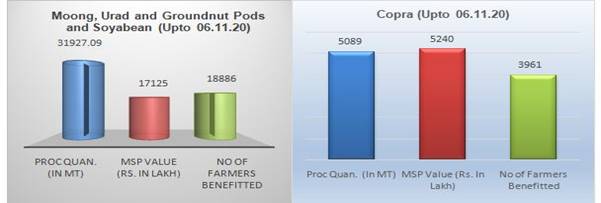
Upto 06.11.2020, the Government through its Nodal Agencies has procured 31927.09 MT of Moong, Urad, Groundnut Pods and Soyabean having MSP value of Rs.171.25 Crores benefitting 18886 farmers in Tamil Nadu, Maharashtra, Gujarat, Haryana and Rajasthan as against the last year corresponding purchase of 16633.39 MT which is an increase of 91.95% for pulses and oilseeds.
Similarly, 5089 MT of copra (the perennial crop) having MSP value of Rs. 52.40 Crore has been procured benefitting 3961 farmers in Karnataka and Tamil Nadu upto 6.11.2020 as against the last year corresponding purchase of 293.34 MT of copra. In respect of Copra and Urad, rates are ruling above MSP in most of the major producing States. The respective State/UTs Governments are making necessary arrangements for commencement of procurement from the date as decided by the respective States based on the arrivals in respect of Kharif Pulses and Oilseeds.
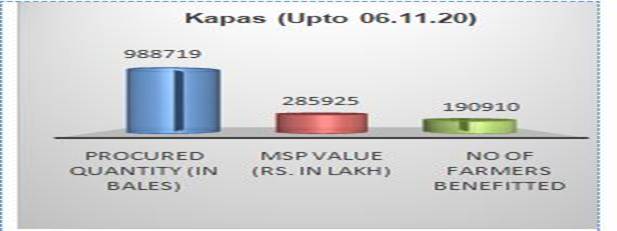
Procurement operations of seed cotton (Kapas) under MSP are going on smoothly in the States of Punjab, Haryana, Rajasthan Madhya Pradesh,Telangana, Andhra Pradesh, Maharashtra and Gujarat. Till 06.11.2020 a quantity of 988719 cotton bales valuing Rs.2859.25 Crore has been procured benefitting 190910 farmers.
****
KAKINADA EXTREME WEATHER EVENTS IN THE MONTH OF NOVEMBER
KAKINADA
EXTREME WEATHER EVENTS IN THE MONTH OF NOVEMBER
|
Year |
Temperature(oC) |
Rainfall (mm) |
||
|
Highest Maximum(Date) |
Lowest Minimum(Date) |
24 Hours Highest (Date) |
Monthly Total |
|
|
2018 |
32.2(6) |
19.3(27) |
62.2(1) |
8.2 |
|
2017 |
33.3(16) |
19.1(4) |
1.4(16) |
1.9 |
|
2016 |
33.8(3) |
18.6(28) |
19.2(5) |
22.6 |
|
2015 |
32.4(5) |
19.4(17) |
33.2(18) |
125.1 |
|
2014 |
34(8) |
18.6(7) |
32(10) |
41.4 |
|
2013 |
31.9(1) |
20.3(13) |
45(23) |
80.1 |
|
2012 |
32.4(8) |
17.7(14) |
203.2(4) |
406.3 |
|
2011 |
35(8) |
18.9(19) |
25.4(1) |
25.4 |
|
2010 |
33.6(13) |
21.5(26) |
184.6(1) |
372.4 |
|
2009 |
34.1(17) |
18.7(29) |
14.3(18) |
28.3 |
|
ALL
TIME RECORD |
35.9(02/2008) |
14.4(28/1970) |
276.4(16/1923) |
696.7(1893) |
CLIMATOLOGICAL TABLE
PERIOD: 1981-2010
|
Month |
Mean Temperature(oC) |
Mean Total Rainfall (mm) |
Mean Number of Rainy Days |
Mean Number of days with |
||||
|
Daily Minimum |
Daily Maximum |
HAIL |
Thunder |
FOG |
SQUALL |
|||
|
Jan |
20.3 |
29.2 |
12.6 |
0.9 |
0 |
0.1 |
0.1 |
0 |
|
Feb |
21.7 |
31.2 |
10.3 |
1.1 |
0 |
0 |
0 |
0 |
|
Mar |
24.0 |
34.0 |
7.5 |
0.5 |
0 |
0.7 |
0.1 |
0 |
|
Apr |
26.2 |
36.2 |
16.4 |
1.1 |
0 |
2.1 |
0 |
0 |
|
May |
27.8 |
37.5 |
42.3 |
2.8 |
0 |
5.2 |
0 |
0 |
|
Jun |
27.3 |
35.8 |
122.8 |
7.1 |
0 |
5.4 |
0 |
0 |
|
Jul |
26.2 |
32.9 |
175.4 |
10.9 |
0 |
5.2 |
0 |
0 |
|
Aug |
25.9 |
32.2 |
176.9 |
10.2 |
0 |
4.7 |
0 |
0 |
|
Sep |
25.9 |
32.7 |
199.4 |
9.1 |
0 |
7.5 |
0 |
0 |
|
Oct |
24.8 |
31.9 |
243.4 |
9.0 |
0 |
6.8 |
0 |
0 |
|
Nov |
22.5 |
30.4 |
98.8 |
3.8 |
0 |
1.3 |
0 |
0 |
|
Dec |
20.3 |
29.2 |
10.7 |
0.9 |
0 |
0 |
0 |
0 |
|
Annual |
24.4 |
32.8 |
1116.6 |
57.5 |
0 |
39 |
0.1 |
0 |
Subscribe to:
Posts (Atom)