Saturday, 30 July 2022

New Forest Conservation Rules, 2022


New Forest Conservation Rules, 2022

Posted On: 28 JUL 2022 3:44PM by PIB Delhi

As per the provisions of Forest (Conservation) Act, 1980, the Approval of the Central Government under the Forest (Conservation), Act 1980 is a prior approval of the Central Government which does not directly lead to non-forestry use or breaking of forest land.  Process of approval for diversion of forest land culminates after issuance of final diversion order by the State Government or UT concerned which authorizes use of forest land for intended purpose and hands over the land to the user agency.

Provisions of the Forest(Conservation)Rules,2022 under sub clause b(ii) of sub rule 6 of rule 9 provide that “The State Government or Union territory Administration, as the case may be, after receiving the ‘Final’ approval of the Central Government under Section 2 of the Act, and after fulfillment and compliance of the provisions of all other Acts and rules made there under, as applicable including ensuring settlement of rights under the Scheduled Tribes and Other Traditional Forest Dwellers (Recognition of Forest Rights) Act, 2006 (No. 2 of 2007), shall issue order for diversion, assignment of lease or dereservation, as the case may be” imply that Forest (Conservation) Rules,2022 emphasize the compliance of the provisions of all Acts and Rules.

Forest (Conservation) Rules, 2022 have been promulgated solely to implement the provisions of the Forest (Conservation) Act, 1980. Process as envisaged in the Act and the rules framed there under is a parallel process with other statutory processes. The Rules do not inhibit the commencement of processes envisaged in other laws like Wildlife (Protection) Act, 1972, Environment (Protection) Act, 1986, Land Acquisition Act, 1896, Forest Rights Act, 2006, etc. Provisions envisaged in other statutory laws can be undertaken simultaneously by the respective nodal implementing agencies. The State Government or Union territory may ensure compliance of such statutes at the very initial or at any other stage as the provisions of Forest (Conservation) Rules, 2022 do not bar the authorities to do so, but in in any case, it should be done before handing over forest land to the user agency.  

This information was given by the Minister of State for Environment, Forest & Climate Change, Shri Ashwini Kumar Choubey in a written reply in Rajya Sabha toda

Tadoba Tiger Reserve, Maharashtra plays host for National Global Tiger Day Celebrations 2022

 Ministry of Environment, Forest and Climate Change


Tadoba Tiger Reserve, Maharashtra plays host for National Global Tiger Day Celebrations 2022

Government demonstrated its commitment to tiger conservation by increasing number of tiger reserves to 52: Shri Bhupender Yadav

The government is committed towards the well-being of the people who inhabit tiger bearing landscapes: Shri Yadav

We should imagine a future of peaceful co-existence of man, animal and nature: Shri Ashwini Kumar Choubey

Posted On: 29 JUL 2022 11:35AM by PIB Delhi

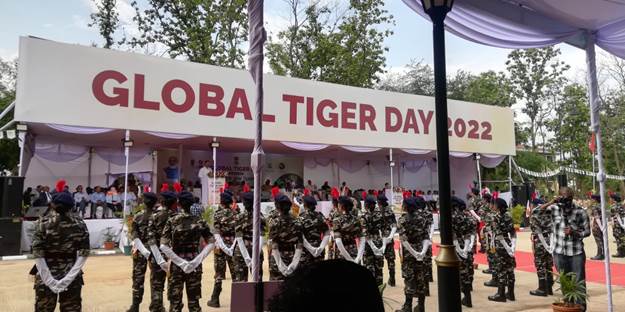
Union Minister of Environment, Forest & Climate Change, Shri Bhupender Yadav and Minister of State for Environment, Forest & Climate Change, Shri Ashwini Kumar Choubey attended the Global Tiger Day 2022 Celebrations held today at Chandrapur Forest Academy, Maharashtra.


https://static.pib.gov.in/WriteReadData/userfiles/image/image0012XZR.jpg     https://static.pib.gov.in/WriteReadData/userfiles/image/image0020Q61.jpg


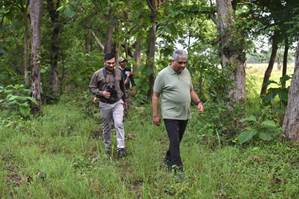
The Ministers, along with other delegates, visited Tadoba Andhari Tiger Reserve (TATR) and appreciated the diversity of the landscape, its flora and fauna and had informal interactions with the forest staff & tiger reserve management to understand the field level protection issues.


Tadoba Anderi Tiger Reserve has a landscape with a high-density of tigers that co-exist with the local population. Shri Yadav was deeply appreciative of the dedication of the staff in carrying out enforcement activities specially the mobile application based smart patrolling called MSTRIPES. He also appreciated the unique community-based ecotourism model which is providing livelihood opportunities to the locals and has helped win support for the reserve.


https://static.pib.gov.in/WriteReadData/userfiles/image/image003O827.jpg


Global Tiger Day celebrations were held in Forest Academy in Chandrapur. Union Minister received the guard of honour by Special Tiger Protection Force, an exclusive regimented strike force from Tiger Reserves of Maharashtra & Kerala Forest Department.


     https://static.pib.gov.in/WriteReadData/userfiles/image/image0048A70.jpg            https://static.pib.gov.in/WriteReadData/userfiles/image/image005NNSD.jpg


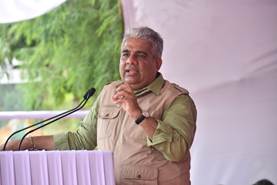
Shri Bhupender Yadav congratulated all tiger range countries, and commended India in particular for setting a benchmark in conservation for having & protecting more than 70% of global tiger population. He said that the Government of India has demonstrated its commitment to tiger conservation by increasing number of tiger reserves from initial nine in 1973 to the current 52, the latest being Ramgarh Vishdhari in Rajasthan.  The government is committed towards the well-being of the people who inhabit these tiger bearing landscapes through creation of various livelihood opportunities and interventions. He commended Maharashtra for implementing the unique Shyama Prasad Mukherjee Jan Van Vikas Yojana which provides for schemes for the welfare of people living in and around tiger reserves which is worth emulating by other states.


To avoid complacency, an unbiased, independent, management effectiveness evaluation is conducted quadrennially involving outside experts in the wildlife conservation and also the All India Tiger Estimation once in four years and is currently being carried out for the fifth time, the Minister shared. He mentioned with pride that this unique exercise done in 2018 has entered the Guinness book of world record. He emphasized on promoting low impact sustainable tourism in Tiger Reserves with maximization of visitor satisfaction and direct benefit sharing with locals. He shared that India has taken up a high priority conservation project to bring back Cheetah which went extinct in 1952 by embarking on cheetah introduction programme which is at an advanced stage of implementation. The bilateral agreement with Namibian Government is already signed and the MoU with South Africa will be signed soon. He appreciated all the field staff for the commitment shown for tiger conservation which has put the country in number one position globally.


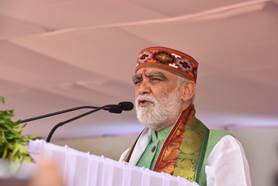
Shri Ashwini Kumar Choubey stressed that tiger symbolises power, plays a crucial role in conservation of biodiversity, forest, water and climate security. He stated that it is a matter of great pride that India is a global leader in tiger conservation and is collaborating with countries like Cambodia, China, Bangladesh, Bhutan, Nepal, Myanmar and Russia for coming together for the cause of tiger conservation.  We should imagine a future of peaceful co-existence of man, animal and nature, said the MoS.


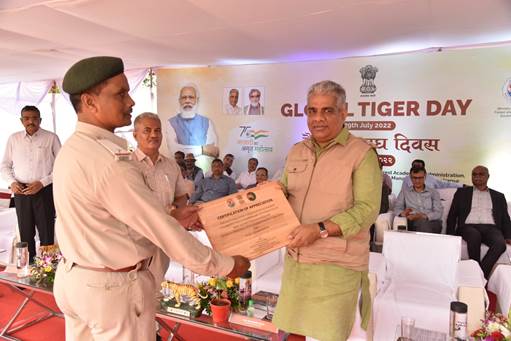
Front line staff were felicitated and rewarded with NTCA annual award of Rs 1 lakh each to two Foresters, two Forest Guards and two Watchers/protection assistants/ Tiger Trackers by the Hon’ble Minister in recognition of their extraordinary performance in the field of tiger conservation, as a part of the celebrations.


                    https://static.pib.gov.in/WriteReadData/userfiles/image/image006182N.jpg


The event was also attended by local public representatives, Field Directors of the Tiger Reserves in the Country and Senior Forest Officials from the State of Maharashtra besides the contingent of Special Tiger Protection Force from Maharasthra and Kerala.

The declaration to celebrate Global Tiger Day was taken on 29th July 2010 at St Petersberg  in order to bring all tiger range countries together for increased thrust on tiger conservation and management globally. Since then this day is symbolically celebrated as Global Tiger Day.

Problem of Marine Pollution


Problem of Marine Pollution

Posted On: 28 JUL 2022 1:21PM by PIB Delhi

The Governments of India, Singapore, and Australia jointly organized an online EAS Marine Plastic Debris workshop on 14th and 15th February 2022. About 100 participants from thirteen countries participated in the workshop and deliberated on four different themes:


  • The magnitude of the marine litter problem: monitoring programs and research on plastic debris in the Indo-Pacific Region.
  • Best practices, novel approaches, and solutions to prevent plastic pollution.
  • Polymers and plastics: technology and innovations.
  • Opportunities for regional collaboration to remediate or stop plastic pollution.


Marine Litter is monitored in coastal water, sediment, beach, and biota and analyzed for micro/ meso/ macro plastics pollution. An increase in the abundance of microplastics observed along the east coast during the monsoon with relatively higher concenations at river mouth. Urban beaches have higher accumulation rates than rural beaches. Under the pan India coastal monitoring, beach clean-up activities at regular intervals to assess the marine litter from 2018-2022, it was found that the majority of the waste with more than 50% composition was contributed by Single-Use Plastics (SUPs).

Ministry of Earth Sciences through its attached office National Centre for Coastal Research (NCCR) has initiated monitoring of temporal and spatial distribution of marine litter and plastic debris along the Indian coasts and adjacent seas. The research so far indicates that plastic debris is spread along entire water column and sediment and high quantities are noticed during monsoon due to its spread into coastal water through creeks/rivers/estuaries by rainwater.

Low cost floating debris traps at small river mouths, creeks and canals to prevent the inflow of the plastic to the sea was installed and trapping floating debris in the harbour and port areas can be deployed to trap the floating plastics and debris.

The participants agreed that litter pollution being transboundary, collaborative action plans are important for combating this menace. The following suggestions were given:


  • Ban on single-use plastic, behavioural changes in plastic use
  • Technology can track or stop plastic from entering our oceans
  • Initiate activities at a local level, regional level, national and international level.
  • Local placed-based solutions to tackle the issues
  • Responsibility needs to extend high up in the supply chain and change in behaviour to the plastic used in packaging by brands/producers.
  • Strengthening baseline information through monitoring programs and research to inform policymakers
  • Sharing of plastic monitoring data which helps to build a dataset to countermeasure and reduce ocean plastics
  • Identify and develop technologies for eco-friendly alternatives to plastic
  • Enforcement of policy and regulation
  • Enhancement of waste management system.
  • Enhancing the dialogue between countries
  • Technology that innovates the repurposing, recycling, and reuse of plastic waste Citizen science, education, community program, and outreach


      This information was given by the Minister of State (I/C) for M/o Earth Sciences and M/o Science & Technology, Dr. Jitendra Singh in a written reply in Rajya Sabha today.

Dr Mansukh Mandaviya chairs the seminar on Safe Use of Chemicals at Workplace; MoU with ILO on International Chemical Safety Cards (ICSCs) signed


Dr Mansukh Mandaviya chairs the seminar on Safe Use of Chemicals at Workplace; MoU with ILO on International Chemical Safety Cards (ICSCs) signed

Industry and workers’ safety has been India’s top priority; can be ensured by adhering to International standards, robust procedures, training sessions and technologies: Dr Mansukh Mandaviya

“Government collaborating with ILO to create a cadre of trainers to further ensure safety measures in industries”

Training sessions and safety mock drills are not only important for workers’ safety but also play a key role for our environment: Shri Bhagwanth Khuba

Posted On: 27 JUL 2022 2:15PM by PIB Delhi

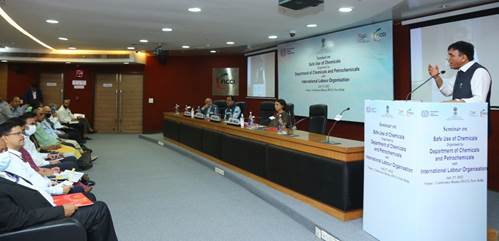
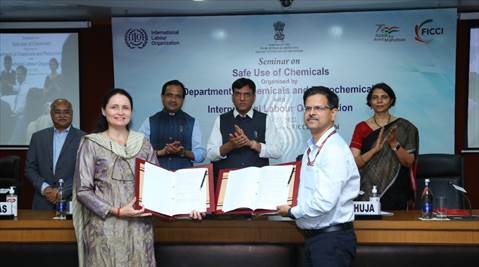
Union Minister for Chemicals and Fertilisers, and Health & Family Welfare, Dr. Mansukh Mandaviya chaired a seminar on “Safe Use of Chemicals at Workplace”, here today. Shri Bhagwanth Khuba, Minister of State (Chemicals & Fertilizers and New & Renewable Energy) was graced the occasion. The seminar was organised by Department of Chemicals and Petrochemicals (DCPC)and International Labour Organisation (ILO).. A Memorandum of Understanding (MoU) was signed in presence of Union Minister Dr. Mandaviya between DCPC and ILO for adopting the International Chemical Safety Cards (ICSCs).

https://static.pib.gov.in/WriteReadData/userfiles/image/image0023NII.jpg

Dr. Mansukh Mandaviya said that Worker’s safety and humane behaviour have been India’s top priority. We have accepted global best practices wholeheartedly to ensure development and welfare of our citizens. He mentioned that “chemical industry is a critical and integral part of the growing Indian economy. It occupies a vital position in meeting our basic needs, developmental needs and improving the quality of our daily lives.”

https://static.pib.gov.in/WriteReadData/userfiles/image/image003W3LB.jpg

He underlined that often catastrophic accidents can happen related with chemicals, mainly due to lack of proper safety measures. This calls for adhering to global safety standards and practices, he noted. “It is crucial that international standards developed by ILO are adopted by India as this will not only mitigate industrial accidents but also ensure further alignment with global best practices”, he added. He exhorted all stakeholders to ensure that information about not only these ICSCs but also safety regulations are conveyed adequately to the workers. He said that “Industry safety can be ensured by adhering to international standards for storage and processing, putting safest and efficient procedures, installing robust technologies in place. This can be ensured by spreading awareness and creating capacity building among workers through training sessions”.

Dr. Mandaviya urged various stakeholders including government officials, experts and industry leaders to engage in a brainstorming session. He said that such stakeholder consultations will bring out innovative ideas which can be further used as basis of future legislations and steps.

Shri Bhagwant Khuba,  Minister of State for Chemicals and Fertilizers and New & Renewable Energy noted that India’s stature has risen globally in chemical sector and thus it becomes a need that we look at the sector not just from production basis but safety aspects as well. He said that the Industrial workers from floor-level to managerial level must be made aware of possible hazards at workplace and must be equipped with adequate knowledge to deal with them in case of any emergency. He said that such training sessions and safety mock drills are not only important for workers’ safety but also play a key role for our environment as well. He also thanked all the participants and echoed the need that “all stakeholders must learn and grow together as only this could ensure that our industries function without any harm and hazard, without losing any lives.” He was hopeful that this MoU between DCPC and ILO would further enforce our efforts in implementation of safety regulations in the country.

About International Chemical Safety Cards (ICSCs)

The International Chemical Safety Cards (ICSCs) are data sheets intended to provide essential safety and health information on chemicals concisely. The primary aim of the Cards is to promote the safe use of chemicals in the workplace. The main users are workers and those responsible for occupational safety and health.

The International Chemical Safety Cards (ICSCs) will be used by the department to disseminate the appropriate hazard information on chemicals at the workplace in an comprehensible and easy manner. To date, 1784 Chemicals Safety Cards are available. The ICSCs are developed by the World Health Organization (WHO) and the International Labour Organisation (ILO) with cooperation of the European Commission and are regularly updated to take account of the latest scientific developments. These cards are helpful for dissemination of the appropriate hazard information on chemicals to industry associations to promote safe use of chemicals in the workplace.


Ms. Arti Ahuja, Secretary (Dept. Of Chemicals & Petrochemicals), Shri Susanta Kumar Purohit, Joint Secretary, Ms. Dagmar Walter, Director, ILO, Shri Prabh Das, Chairman, FICCI Petrochemical Committee and other industry leaders were present in the meeting.

*****

MV

Friday, 29 July 2022

World Nature Conservation Day 2022: History, importance and significance

 World Nature Conservation Day 2022: History, importance and significance

The theme of World Nature Conservation day 2022 is 'Living Sustainably in Harmony with Nature.'

NFCL -Shri KVK Raju  was a visionary with firm belief in his mission to serve society through industry & HARMONY WITH NATURE.

World Nature Conservation Day 2022: World Nature Conservation Day is observed on July 28 every year. The objective is to spread awareness regarding the preservation of nature and biodiversity for a healthy environment which is required for stable and prospering humankind. It is also marked as the day to create positive opinions about climate change.

One of the major efforts of World Nature Conservation Day is to tell society about the importance of flora and fauna that are threatened with extinction.

World Nature Conservation Day Importance

This special day emphasises preserving several components of nature. It also aims to generate public action to preserve the environment for posterity. Among them, pushing for the adoption of sustainable practices and lawmakers taking policy decisions that are economically viable are important to bolster the fight to conserve the Earth.

World Nature Conservation Day 2022 History

Human activities during the last century have had a devastating impact on natural vegetation and other resources. The quest for rapid industrialization and cutting down of forest cover to make space for the ever-growing population has caused climate change and other environmental implications.

As much as awareness about environmental conservation has increased in the past few years, there is still a long way to go before positive steps show their results. In recent times, the need for conserving the environment has become more evident. The relentless human overexploitation of resources has led to unusual weather patterns, destruction of wildlife habitats, extinction of species, and loss of biodiversity. Sadly, this is the norm the world over. That’s why organizations

The origin of World Nature Conservation Day is still unknown. The motto behind observing July 28 as World Nature Conservation Day is to create awareness about the importance conserving the nature.

World Nature Conservation Day 2022 Theme

2022: Living Sustainably in Harmony with Nature.

2021: “Forests and Livelihoods: Sustaining People and Planet”.

2020: No theme – due to Covid-19.

2019: “Nature on your mind: understanding our values”

2018: A good reason to celebrate wetlands.

How many types of conservation are there?

Conservation is broadly divided into two types: in-situ (conservation of habitats, species, and ecosystems where they naturally occur) and ex-situ (conservation in the context of natural habitats e.g. through zoos, botanical gardens, and seed banks).

What is the difference between conservation and preservation?

Conservation promotes the sustainable use of nature by humans for activities such as logging, hunting, or mining, while preservation means protecting nature from human use.

Why is biodiversity important?

Biodiversity is vital for a flourishing natural world, as well as supporting economies, livelihoods, food security, and the health of humans.

How to Observe World Nature Conservation Day

1.        Cut down on plastic use -Plastic is cheap and very convenient to use, but it comes with environmental implications. Plastic products are non-biodegradable and are an eyesore in our surroundings. Switch to products made of degradable and natural components instead.

2.        Check e-waste-With the fast-changing pace of technology, people buy new electronic items without thinking about where the old products end up. Most of the e-waste produced is improperly disposed of. Aim to reduce your e-waste and look for recycling options before buying new products.

3.        Save water-One of the biggest effects of climate change has been the decreasing level of safe drinking water. Simple steps like turning off water taps when not in use can save thousands of gallons of water in a year.

Why We Love

1.        Extinction is happening on a massive scale-Around one million species of plants and animals are nearly extinct.

2.        More reserves are needed-Only 12.5% of the landmass on Earth is dedicated to natural reserves.

3.        Expensive invasive species-The U.K., the U.S., India, South Africa, Brazil, and Australia suffer an annual combined loss of $316 billion due to invasive species.

4.        Wildlife population sizes have greatly declined-The W.W.F.’s Living Planet Report 2020 states that there has been an average 68% drop in the global population sizes of birds, amphibians, fish, mammals, and reptiles between 1970 and 2016.

5.        Freshwater species are declining the fastest-Freshwater wildlife species populations are declining disproportionately faster than others, decreasing by an average of 84% between 1970 and 2018.

Why World Nature Conservation Day is Important

1.        It reminds us to stay mindful -Sometimes people become unconsciously reckless in their interactions with the environment. This day is a reminder to treat the Earth with respect.

2.        It protects the environment-The natural world has suffered so much destruction at the hands of human beings. World Nature Conservation Day protects the environment from further harm.

3.        It’s a chance to make a real impact-Conservation can sometimes feel like an abstract concept. This day helps us put things into perspective and make tangible positive changes.


Dr. Amar Nath Giri
EHSQ


("Many Species: One Planet ,One Future)
.

Saturday, 23 July 2022

Monthly Production Report for June 2022

 Ministry of Petroleum & Natural Gas

azadi ka amrit mahotsav

Monthly Production Report for June 2022

Posted On: 22 JUL 2022 3:50PM by PIB Delhi
  1. Production of Crude Oil

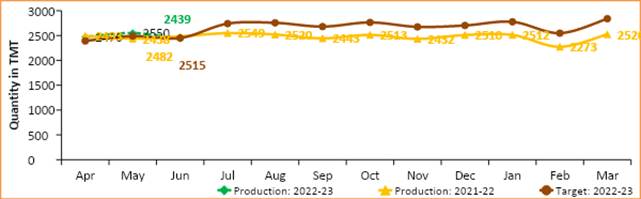
Crude oil production during June 2022 was 2439.32 TMT, which is 3.01% lower than target for the month and 1.71% lower than the production of June 2021. Cumulative crude oil production during April-June, 2022 was 7459.22 TMT, which is 1% lower than target for the period but 0.62% higher than production during corresponding period of last year respectively. Unit-wise and State-wise crude oil production is given at Annexure-I. Unit-wise crude oil production for the month of June 2022 and cumulatively for April-June 2021-22 vis-à-vis same period of last year has been shown in Table-1 and month-wise in Figure-1.

Table-1: Crude Oil Production (in TMT)

Oil Company

Target

June (Month)

April-June (Cumulative)

2022-23 (Apr-Mar)*

2022-23

2021-22

% over last year

2022-23

2021-22

% over last year

Target*

Prod.*

Prod.

Target*

Prod.*

Prod.

ONGC (Nomination Block)

19869.61

1643.50

1625.29

1621.92

100.21

4987.83

4969.63

4812.14

103.27

OIL (Nomination Block)

3571.00

274.72

257.17

246.52

104.32

804.49

773.85

742.34

104.24

Pvt/JVs (PSC/RSC Regime)

7400.88

596.69

556.86

613.32

90.79

1742.47

1715.74

1858.52

92.32

Total

30841.49

2514.92

2439.32

2481.75

98.29

7534.79

7459.22

7413.00

100.62

  • Note: Totals may not tally due to rounding off. *: Provisional


Figure-1: Monthly Crude Oil Production

Unit-wise production details with reasons for shortfall are as under:
 

  1. Crude oil production by ONGC (Oil and Natural Gas Corporation) in nomination block during June 2022 was 1625.29 TMT, which is 1.11% lower than target of the month and 0.21% higher when compared with production of June 2021. Cumulative crude oil production by ONGC during April-June, 2022 was 4969.63 TMT, which is 0.36% lower than target for the period but 3.27% higher than target for the period and production during corresponding period of last year respectively. Production is mainly lower due to lower condensate generation in Bassein and Tapti Daman area.
  1. Crude oil production by OIL (Oil India Ltd) in the nomination block during June 2022 was 257.17 TMT, which is 6.39% lower than the target of the month but 4.32% higher when compared with production of June, 2021. Cumulative crude oil production by OIL during April-June 2022 was 773.85 TMT, which is 3.81% lower than target for the period but 4.24% higher when compared production during corresponding period of last year. Reasons for shortfall in production are as under:


  • Less than planned contribution from workover wells.
  • Loss due to miscreant activities in Main Producing Area (MPA).
  1. Crude oil production by Pvt/JVs companies in the PSC/RSC regime during June 2022 was 556.86 TMT, which is 6.68% lower than the target of the reporting month and 9.21% lower than the month production of June 2021. Cumulative crude oil production by Pvt/JVs companies during April-June 2022 was 1715.74 TMT, which is 1.53% and 7.68% lower than target for the period and production during corresponding period of last year respectively. Reasons for shortfall in production are as under:
  • CB-OS/2 (VEDANTA): Shortfall due to delay in Drilling campaign.
  • MB/OSDSF/B80/2016 (HOEC) Production shortfall due to D1 well is shut-in due to operational issues and Plant shut-down multiple times due to process shut-down.
  • RAVVA (VEEDANTA): Production shortfall due to RE wells were shut for rig move activities, leading to reduced monthly realization and Increased water cut in RE-5
  • RJ-ON-90/1 (VEDANTA): Production shortfall due to Few well failures in ABH & NL; Well failures and higher injection losses to de risk infill drilling in Bhagyam. Some well shut-in due to SRP pump issues in Guda, Kaameshwari West, Raaggeshwari Oil.
  • CB-ONN-2000/1 (GSPC): Few wells not producing due to possible casing damage, snapped/unscrewed sucker rod string.
  1. Production of Natural Gas

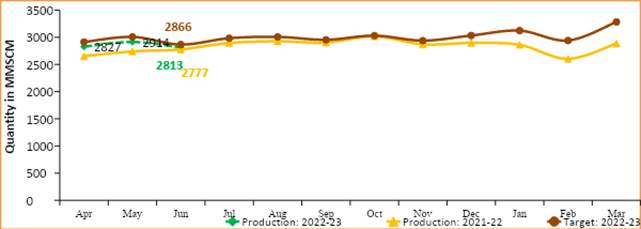
Natural gas production during June 2022 was 2812.78 MMSCM, which is 1.85% lower than the monthly target but 1.29% higher than production of June 2021. Cumulative natural gas production during April-June 2022 was 8553.16 MMSCM, which is 2.63% lower when compared with target for the period but 4.71% higher than production during corresponding period of last year. Unit-wise and state-wise natural gas production is given at Annexure-II. Unit-wise natural gas production for the month of June 2022 and cumulatively for April-June 2021-22 vis-à-vis same period of last year has been shown in Table-2 and month-wise in Figure-2.

Table-2: Natural Gas Production (in MMSCM)

Oil Company

Target

June (Month)

April-June (Cumulative)

2022-23 (Apr-Mar)*

2022-23

2021-22

% over last year

2022-23

2021-22

% over last year

Target*

Prod.*

Prod.

Target*

Prod.*

Prod.

ONGC (Nomination Block)

20381.94

1627.43

1637.24

1684.40

97.20

5076.75

5086.56

5051.93

100.69

OIL (Nomination Block)

3717.84

305.55

246.75

230.14

107.22

924.79

742.78

675.20

110.01

Pvt/JVs (PSC/RSC Regime)

11968.32

932.86

928.80

862.44

107.69

2782.31

2723.82

2441.02

111.59

Total

36068.10

2865.83

2812.78

2776.98

101.29

8783.85

8553.16

8168.15

104.71

Note: Totals may not tally due to rounding off. *: Provisional


Figure-2: Monthly Natural Gas Production


  1. Natural gas production by ONGC (Oil and Natural Gas Corporation) in the nomination blocks during June 2022 was 1637.24 MMSCM, which is 0.6% higher target for the month but 2.8% lower than the production of June 2021. Cumulative natural gas production by ONGC during April-June, 2022 was 5086.56 MMSCM, which is 0.19% and 0.69% higher than target for the period and production during corresponding period of last year respectively.
  • Less Free gas production in MH field and normalization of gas throughput towards Uran after hook up jobs for new slug catcher, leading to less sweet gas towards Hazira side.
  • Delay in HF in Mandapeta & Natural Decline in Psarlapudi and Kesanapalli-W fields in Rajahmundry.
  • Potential decline and ceasure of wells in Gandhar field in Ankleshwar Asset.
  • S/D of OTPC unit#2 for Annual Maintenance since 23.05.2022 in Tripura.
  • Decline in AG in Geleki field & FG in Laiplingaon field in Assam Asset.
  1. Natural gas production by OIL (Oil India Ltd) in the nomination block during June 2022 was 246.75 MMSCM which is 19.24% lower than the target for the month of current year but 7.22% higher than production of corresponding month of last year. Cumulative natural gas production by OIL during April-June 2022 was 742.78 MMSCM, which is 19.68% lower than target for the period but 10.01% higher than production during corresponding period of last year. Reasons for shortfall in production are as under:
  • Low upliftment/demand of gas by the major customers.
  • Less than planned contribution from drilling wells and old wells.
  1. Natural gas production by Pvt/JVs companies in the PSC/RSC/CBM regime during June 2022 was 928.80 MMSCM, which is 0.43% lower than the target for the month but 7.69% higher when compared the production of June 2021. Cumulative natural gas production by Pvt/JVs during April-June, 2022 was 2723.82 MMSCM, which is 2.1% lower than target for the period but 11.59% higher than production during corresponding period of last year. Reasons for shortfall in production are as under:
  • AAP-ON-94/1 (HOEC): Production Shortfall due to Low consumer demand.
  • CB-OS/2 (VEDANTA): Shortfall due to delay in Drilling campaign.
  • MB/OSDSF/B80/2016 (HOEC) Production shortfall due to D1 well is shut-in due to operational issues and Plant shut-down multiple times due to process shut-down.
  • RJ-ON/6 (FEL): Less offtake of gas by buyer for two days and natural decline from wells.
  • RAVVA (VEEDANTA): Production shortfall due to RE wells were shut for rig move activities, leading to reduced monthly realization and Increased water cut in RE-5


  1. Crude Oil Processed (Crude Throughput)


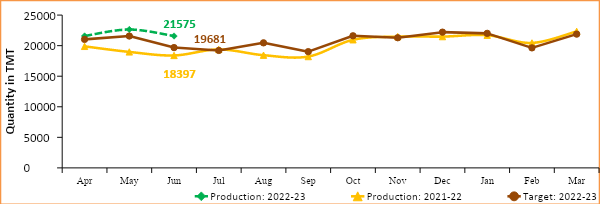
Crude Oil Processed during June 2022 was 21574.57 TMT, which is 9.62% higher than target for the month and 17.27% higher than the June 2021. Cumulative crude processed during April-June 2022 was 65798.09 TMT, which is 5.64% and 14.92% higher than target for the period and production during corresponding period of last year respectively. Refinery-wise details of the crude throughput and capacity utilization during the month of June 2022 vis-à-vis June 2021 are given at Annexure-III and Annexure-IV. Company-wise crude throughput for the month of June 2021 and cumulatively for the period April-June 2022 vis-à-vis same period of last year has been shown in Table-3 and month-wise in Figure-3.

Figure 3: Crude Oil Processed (Crude Throughput)

Table 3: Crude Oil Processed (Crude Throughput) (in TMT)

Oil Company

Target

June (Month)

April-June (Cumulative)

2022-23 (Apr-Mar)*

2022-23

2021-22

% over last year

2022-23

2021-22

% over last year

Target*

Prod.*

Prod.

Target*

Prod.*

Prod.

CPSE

154983.78

11870.45

13454.57

10464.97

128.57

38679.02

41319.46

33301.10

124.08

IOCL

69999.90

5874.97

6276.80

5358.33

117.14

18092.31

18936.47

16721.43

113.25

BPCL

37000.00

2695.00

2895.38

2467.58

117.34

9375.00

9559.88

8306.96

115.08

HPCL

18920.85

1258.50

1633.54

785.28

208.02

4250.10

4809.55

2508.01

191.77

CPCL

10300.00

600.00

972.61

645.55

150.66

2430.00

2882.25

2034.51

141.67

NRL

2800.00

236.62

240.56

192.73

124.82

717.75

786.62

640.03

122.90

MRPL

15900.00

1200.00

1428.97

1009.62

141.53

3800.00

4325.14

3070.48

140.86

ONGC

63.04

5.36

6.72

5.88

114.40

13.87

19.55

19.70

99.27

Pvt/JVs

94637.83

7810.72

8120.00

7932.04

102.37

23604.03

24478.63

23954.75

102.19

HMEL

11451.93

941.61

1078.48

1062.92

101.46

2873.50

3229.52

3224.22

100.16

RIL

63021.49

5219.35

5361.90

5219.35

102.73

15755.52

16184.00

15755.52

102.72

NEL

20164.41

1649.76

1679.62

1649.76

101.80947

4975.01

5065.11

4975.01

101.8111

TOTAL

249621.61

19681.17

21574.57

18397.01

117.27

62283.06

65798.09

57255.85

114.92

Note.Totals may not tally due to rounding off. *: Provisional


3.1 CPSE Refineries’ crude oil processed during June 2022 was 13454.57 TMT, which is 13.35% higher than target for the month and 28.57% higher than the production of June 2021. Cumulative crude throughput during April-June 2022 was 41319.46 TMT which is 6.83% and 24.08% higher than target for the period and production during corresponding period of last year respectively. Reasons for shortfall in production are as under:
 

  • IOCL-Panipat Refinery: Crude processed lower due to high TAN crude processing.
  • IOCL-Paradip Refinery: Crude processed lower due to GY tripping and INDMAX unit shutdown.
  • HPCL-Visakh: Crude processed lower due to shutdown of a primary unit.

3.2 Private & JVs Refineries’ crude oil processed during June 2022 was 8120.0 TMT, which is 3.96% higher than the target for the month and 2.37% higher than the production of June 2021. Cumulative crude throughput during April-June 2022 was 24478.63 TMT, which is 3.71% and 2.19% higher than target for the period and production during corresponding period of last year respectively.
 

  1. Production of Petroleum Products
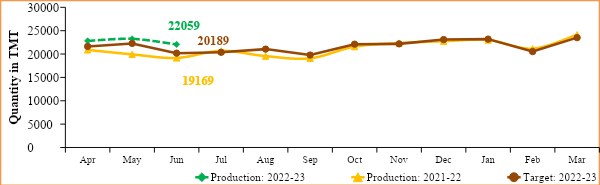
  1. Production of Petroleum Products during June 2021 was 22059.08 TMT, which is 9.27% higher target for the month and 15.08% higher than the production of June 2021. Cumulative production during April-June, 2022 was 68120.47 TMT, which is 6.27% and 13.55% higher than target for the period and production during corresponding period of last year respectively. Unit-wise production of petroleum products is given at Annexure-V. Company-wise production for the month of June 2022 and cumulatively for April-June, 2022 vis-à-vis same period of last year has been shown in Table-4 and month-wise in Figure-4.


Table 4: Production of Petroleum Products (TMT)

Oil Company

Target

June (Month)

April-June (Cumulative)

2022-23 (Apr-Mar)*

2022-23

2021-22

% over last year

2022-23

2021-22

% over last year

Target*

Prod.*

Prod.

Target*

Prod.*

Prod.

CPSE

144648.94

11031.97

12617.72

9771.63

129.13

36064.82

38793.80

31396.40

123.56

IOCL

66322.30

5533.40

5959.39

5016.78

118.79

17148.15

18011.12

15964.32

112.82

BPCL

34005.99

2463.83

2729.21

2323.75

117.45

8614.16

9015.59

7901.48

114.10

HPCL

17495.57

1141.73

1455.73

793.33

183.50

3875.58

4412.01

2413.42

182.81

CPCL

9614.24

561.39

970.88

569.50

170.48

2269.27

2704.00

1789.08

151.14

NRL

2748.86

232.30

256.97

159.72

160.89

704.64

807.19

604.60

133.51

MRPL

14401.95

1094.22

1238.97

902.84

137.23

3439.81

3824.99

2704.78

141.42

ONGC

60.02

5.10

6.57

5.71

115.15

13.20

18.91

18.72

101.01

Pvt/JVs

111404.56

8840.47

9112.28

9075.45

100.41

27130.27

28412.93

27574.68

103.04

HMEL

10528.86

800.18

1043.03

1035.16

100.76

2617.31

3054.71

3061.71

99.77

RIL

81492.18

6427.27

6488.83

6427.27

100.96

19718.00

20556.02

19718.00

104.25

NEL

19383.52

1613.02

1580.42

1613.02

97.98

4794.97

4802.20

4794.97

100.15

Total Refinery

256053.50

19872.43

21730.00

18847.07

115.30

63195.09

67206.73

58971.08

113.97

Fractionators

3888.14

316.10

329.09

322.11

102.16

903.74

913.75

1021.66

89.44

TOTAL

259941.64

20188.53

22059.08

19169.19

115.08

64098.83

68120.47

59992.74

113.55

Note: Totals may not tally due to rounding off. *: Provisional


Figure 4: Monthly Refinery Production of Petroleum Products


  1. Production of petroleum Products by Oil’s Refineries during June 2022 was 21730.0 TMT, which is 9.35% higher than target for the month and 15.3% higher than the production of June 2021. Cumulative production during April-June, 2022 was 67206.73 TMT, which is 6.35% and 13.97% higher than target for the period and production during corresponding period of last year respectively.
  2. Production of petroleum Products by Fractionators during June 2022 was 329.09 TMT, which is 4.11% higher than the target for the month and 2.16% higher than production of June 2021. Cumulative production during April-June, 2022 was 913.75 TMT, which is 1.11% higher than target for the period but 10.56% lower than production during corresponding period of last year respectively.

Click here to see Annexure-I

Click here to see Annexure-II

Click here to see Annexure-III

Click here to see Annexure-IV

Click here to see Annexure-V