Saturday, 28 September 2024

Global Demand for Biofuel to Approach $225.9 Billion in 2028

Global Demand for Biofuel to Approach $225.9 Billion in 2028

AM Green Technology enters biofuels business

 Synopsis: Hyderabad-based AM Green Technology and Solutions B.V. has signed a binding agreement to acquire Finland's Chempolis Oy and Fortum 3 B.V. entities. The company plans to invest $1 billion to develop sustainable aviation fuel plants by 2027, aiming to advance global airline decarbonization through large-scale biorefineries using multiple feedstocks.

By ET Bureau

 Hyderabad-based AM Green Technology and Solutions B.V. (part of AM Green Group), has signed a binding agreement to acquire Finland's Chempolis Oy and Fortum 3 B.V. entities, the company said on Monday.

AM Green added that it will further advance the platform's technological capabilities to process a wider range of feedstocks and invest $1 billion to develop 0.5+ MTPA of Alcohol-to-Jet sustainable aviation fuel plants by 2027 for global airline decarbonization.

https://www.livemint.com/companies/news/am-green-biofuels-acquisition-chempolis-fortum-3-bv-sustainable-aviation-fuel-renewable-energy-biorefinery-11727071847327.html

A new report, global demand for biofuel is projected to increase 6.2% per year between 2023 and 2028 to nearly $225.9 billion. The growing challenges on energy security and the need to mitigate greenhouse gas emissions are some of the major drivers for the growth of the biofuel market. Fuels derived from renewable sources act as a means of addressing the challenges while also providing a potential low-cost alternative to expensive fossil fuels. Domestic production of biofuels from renewable sources can reduce reliance on oil imports and improve energy security.

Gains will also be supported by:

Favorable government policies promoting use of biofuels

Rising demand for cleaner fuels worldwide

Growing awareness of utilizing renewable sources to reduce greenhouse gas emissions

Key Market Players

ADM (US),

Chevron (US),

Valero (US),

Neste (Finland),

Cargill, Incorporated (US)

Mรผnzer Bioindustrie GmbH (Austria),

Aemetis, Inc. (US),

CropEnergies AG (Germany),

Raรญzen (Brazil),

Blue Biofuels, Inc. (US),

Pannonia Bio Zrt. (Hungary),

GreenJoules (India),

Algenol (US).and many more…

by fuel type segment

The biofuel market for ethanol is anticipated to have the biggest market share over the forecast period. Due to its extensive history of production, use, and versatility as a gasoline addition, ethanol is frequently more in demand. Corn and sugarcane are two examples of the agricultural feedstocks used to make ethanol. The vast accessibility of these feedstocks and the presence of supply channels facilitate the uptake of ethanol.

by end-use segment

The aviation segment is expected to grow at the highest CAGR during the forecasted period, owing to the extensive decarbonization efforts in the aviation sector in North America and Europe. One of the major drivers is the usage of biofuels in military aircraft on a commercial scale. Additionally, the rising demand for air cargo transport in terms of volume is one of the drivers for the growth of aviation. The Bioenergy Technologies Office (BETO) of the US Department of Energy empowers energy firms and aviation stakeholders by advancing research, development, and demonstration to overcome barriers to widespread deployment of low-carbon sustainable aviation fuel (SAF).

Europe is expected to be the fastest-growing region in the biofuel market.

Europe is expected to be the fastest growing region in the biofuel market during the forecast period. The European region comprises major economies such as France, UK, Germany, and Poland. The biofuel market in Europe is primarily fueled by the three main types of biofuels, namely ethanol, biodiesel, and renewable diesel. Europe has actively fostered the use of biofuel through various policies and initiatives. The European Union (EU) has established targets for member states to enhance the utilization of renewable energy in transportation, including biofuels like biofuel. The Renewable Energy Directive (RED) and its subsequent revisions have played a pivotal role in shaping biofuel production and consumption in Europe.

Friday, 27 September 2024

About MarketsandMarkets™

 About MarketsandMarkets™

MarketsandMarkets™ has been recently recognized as one of America’s best management consulting firms by Forbes, as per their recent report

Founded in 2009, MarketsandMarkets recognized uncharted business potentials within disruptive trends, forecasting a surge of $25 trillion in new B2B revenues by 2030. In our 13-year journey, we've collaborated with over 10,000companies, generating $140+ billion in revenue impact. From a market research publisher, we've transformed into a growth-enabling leader, backed by a 1500+strong team

Contact:

Mr. Rohan Salgarkar

MarketsandMarkets™ INC.

1615 South Congress Ave.

Suite 103, Delray Beach, FL 33445

USA : 1-888-600-6441

UK +44-800-368-

Asia Pacific is expected to be the fastest-growing region for green ammonia marke

 Asia Pacific is expected to be the fastest-growing region for green ammonia market

Asia Pacific is estimated to be the fastest-growing market for green ammonia market during the forecast period. The region has been segmented by country into Australia, Japan, South Korea, New Zealand, and the Rest of Asia Pacific. The dominance of the Asia Pacific region can be attributed to increasing foreign investments in the region to meet the demand of green fuels for fuel cell vehicles. The region's focus on enhancing energy security is a significant driver. Green ammonia, as an energy carrier and storage solution, helps diversify the energy mix and reduce dependency on imported fossil fuels, thereby enhancing energy security. The Asia Pacific region is witnessing rapid advancements in green hydrogen and ammonia production technologies. Innovations in electrolysis, ammonia synthesis, and process optimization are making green ammonia production more efficient and cost-effective, driving market growth.

According to a latest research, The global Sustainable Fuel Market is projected to reach $299.9 billion by 2029 from an estimated $193.8 billion in 2024, at a CAGR of 9.1% during the forecast period.

 [9/27, 8:34 PM] Dr. AMAR NATH GIRI: According to a latest research, The global Sustainable Fuel Market is projected to reach $299.9 billion by 2029 from an estimated $193.8 billion in 2024, at a CAGR of 9.1% during the forecast period.

Governments throughout the world are enacting stronger environmental restrictions and policies to encourage the use of renewable energy. The fluctuating costs of traditional fossil fuels provide an economic incentive to invest in more stable and predictable sustainable fuel alternatives. Companies are increasingly adopting sustainable fuels as customer knowledge and demand for ecologically friendly products rise.  Many businesses are establishing aggressive sustainability goals, such as using renewable fuels to satisfy their environmental obligations are few of the major drivers anticipated to propel the growth of the market.

[9/27, 8:36 PM] Dr. AMAR NATH GIRI: Based on Fuel type, the sustainable fuel market is segmented into five types of fuels: Biofuels, Biomethane, Hydrogen, Compressed Natural Gas (CNG) and e-fuels. Among them, the Biofuels will be the largest segment. Biofuels are viewed as a greener alternative to fossil fuels, as they reduce GHG emissions significantly and contribute to climate change mitigation. This environmental benefit is a major driver of their expansion. Furthermore, biofuels help to reduce dependency on imported fossil fuels, so improving national energy security. Countries may mitigate the risks of oil price volatility and geopolitical crises by diversifying their energy sources. Furthermore, growing prices for traditional jet fuels encourage the aviation industry to look for more cost-effective and sustainable options, driving demand for aviation biofuel.

[9/27, 8:37 PM] Dr. AMAR NATH GIRI: This report segments the sustainable fuel market based on state into 2 categories: Gas and Liquid. The gas segment is expected to be the fastest-growing segment in the sustainable fuel market. To reduce greenhouse gas emissions, governments throughout the world are implementing stricter environmental restrictions. This legislative drive promotes the use of cleaner alternatives such as biomethane, CNG, and hydrogen, which benefits the gas category in the sustainable fuel market. Furthermore, advances in gas generation, storage, and distribution technologies have considerably enhanced the efficiency and viability of renewable gases such as biomethane and hydrogen. alternative developments cut prices while increasing the usefulness of alternative fuels. Furthermore, sustainable gasses improve energy security by lowering reliance on imported fossil fuels. Diversifying the energy mix with local and renewable gas sources helps to stabilize energy supply and costs, which encourages their use.

Green Ammonia Market worth $6.2 billion by 2030

 Green Ammonia Market worth $6.2 billion by 2030

The global Green Ammonia Market is estimated to grow at a CAGR 66.0% between 2024 to 2030 to reach a market size of USD 6.2 billion by 2030, from an estimated USD 0.3 billion in 2024. Green ammonia may be produced using renewable energy sources such as wind and solar power. This integration promotes the use of excess renewable energy, which would otherwise be limited, and converts it into a reliable and transportable source of energy. This ability to store and transmit renewable energy minimizes intermittency while increasing system stability. The chemical, fertilizer, and industrial industries are under growing pressure to adopt sustainable practices and reduce their carbon footprint. Green ammonia is a possible option for these companies to produce green chemicals and fertilizers that fulfill sustainability and regulatory requirements.

The development of a global hydrogen economy is driving the demand for green ammonia. As an efficient hydrogen carrier, green ammonia is crucial for transporting hydrogen over long distances and enabling its use in various applications, including power generation, transportation, and industrial processes.

18 Interesting Facts about Water

Facts about Water

water molecule

Here are 18 interesting facts about water, one of the simplest and most abundant compounds in the universe.

18 Interesting Facts about Water

By Dr. Doug Stewart

1. Water is a compound made of two of the universe’s most abundant elements: hydrogen and oxygen. (Only helium is more abundant that oxygen in the universe, but helium forms no compounds.)


2. Water’s chemical formula H2O is better known than that of any other compound.


3. The speed of light in water is three-quarters of its speed in air. This speed difference causes light to refract (change direction) as it passes between air and water. The result of this is that things underwater viewed at an angle from land are not actually in the exact locations our eyes and brains suggest they are.


4. The speed of sound in water is 4.3 times faster than in air at 20 °C. In one second sound travels:


344 meters through dry air

1483 meters through freshwater

1522 meters through seawater


5. Low frequency sounds can travel huge distances in water with little decrease in volume. This allows whales to communicate over vast distances in the oceans.


humpback whale

The low frequency calls of humpback whales can, in favorable conditions, travel thousands of miles in the oceans.


6. Water’s solid state is less dense than its liquid state. The result is that ice floats on water. This is extremely unusual – the opposite applies to almost all other substances. If ice were to sink in water, our world would be a very different place. Ice would accumulate at the bottom of the sea with huge implications for climate and life.


Icebergs floating on water are only possible because of water’s unusual behavior.


7. Unusually, raising the pressure on ice lowers its melting point. When an ice skater moves across ice, the high pressure from the blades of the skates melts a thin layer of ice directly beneath them. This thin layer of water on ice has very low friction, resulting in very easy movement for the skater – either gracefully in the case of experienced skaters, or often an ungraceful fall for inexperienced skaters.


skating


8. Water has a pH of 7. It is neutral on the acid-base scale.


The acid-base scale.

Water is neutral on the pH-scale.


9. Water has a very low molecular mass of only 18, made up of two hydrogens and one oxygen (1 + 1 + 16 = 18). On this basis, oxygen should be a gas a room temperature. If this were the case, life would be impossible.


However, the electric charge within a water molecule is unevenly distributed. Although, overall, every water molecule is electrically neutral the oxygen atom is slightly negatively charged and the hydrogens are slightly positive. This results in hydrogen bonds forming between water molecules, dramatically raising water’s melting and boiling points to their well-known values.


Hydrogen bonding

Hydrogen bonding between separate molecules has a dramatic effect on the properties of water.


10. Water’s polar bonds allow it to dissolve many substances, making it an ideal solvent for the chemistry of life.


11. Water covers 71 percent of our planet’s surface with the result that its color viewed from space is blue.


Our blue planet with the moon crossing.

Our blue planet with the moon crossing.


12. Water acts as a solvent for oxygen gas. If it didn’t there could be no fish. The colder the water, the more oxygen it can hold.


13. Water is vital for all known life forms. In humans, over half our body weight is simply water. Adult males need a daily intake of about 3 liters and females about 2 liters of water. This needn’t come from pure water: it can come from other drinks and, of course, much of the food we eat is mainly water.


water in humans

Water is a major component of most parts of our bodies.


14. Although pure water looks transparent, it is actually very slightly blue.


15. Water has high surface tension, allowing objects whose density should cause them to sink to float.


surface tension water

Steel is denser than water and would normally sink. If the steel is light enough, such as the paperclip here, the water’s surface tension holds the steel on the outside of the water.


16. In addition to its high surface tension, water is rather sticky, which allows drops of it to gather in all sorts of places.


dew drops

Water surface tension and stickiness allow dew drops to form and gather, for example on this web.


17. Totally pure water is a very poor conductor of electricity. However, none of the water we encounter in our everyday lives is totally pure. Everyday water, which contains dissolved substances, is a rather good electrical conductor.


18. Water has a high heat capacity. It takes much more energy to raise the temperature of a kilogram of water by 1 degree than a kilogram of rock. You’ve probably noticed that when the sun beats down on rock, the rock gets much hotter than water does under the same sun. Water also releases much more energy when it cools than rock does. This is why the seasonal variation in temperatures in coastal areas and islands is usually much less than seen in the centers of continents.


Thursday, 26 September 2024

Tecnimont awarded green ammonia plant study in India

 Tecnimont awarded green ammonia plant study in India

7/15/2024 12:00:00 PM

TECNIMONT will carry out an Engineering Design Study (Phase 1 of the FEED) for a 200,000metric ton-per-year green ammonia plant

NEXTCHEM will provide its proprietary digital tool, ArcHy, to optimize renewable power usage, resulting in capex and opex efficiency of the plant lifecycle and minimizing the cost of ammonia

MAIRE announced that TECNIMONT (Integrated E&C Solutions), through its Indian subsidiary Tecnimont Private Limited (TCMPL), together with NEXTCHEM (Sustainable Technology Solutions), has been awarded an engineering design study (first phase of the front-end engineering design) contract by Sembcorp Green Hydrogen India Pvt Ltd for a green ammonia plant to be located in India.

The study will leverage NEXTCHEM’s digital tool ArcHy (Architecture of Hydrogen systems), to overcome the challenge of the intermittency of renewable power usage, resulting in capex and opex efficiency of the plant lifecycle. In particular, ArcHy digital tool will use renewable energy production profiles, collected over a 1-year period in different weather scenarios, to determine the size of the plant’s components like the electrolyzers, storage systems and green ammonia production facilities with the aim of minimizing the levelized cost of ammonia. Based on the results of this analysis, TCMPL will design all the elements of the facility by providing highly specialized engineering services.

History of World Environmental Health Day

 Every year on September 26, we pause to reflect on our planet's health. World Environmental Health Day encourages us to safeguard our environment for a healthier future. It highlights the importance of clean air, safe water, proper sanitation, and effective waste management. A safe environment directly impacts our well-being, reminding us that neglecting it threatens both nature and ourselves.


History of World Environmental Health Day

Established in 2011 by the International Federation of Environmental Health (IFEH), this day stresses the connection between our environment and human health. The state of our environment significantly influences both our physical and mental well-being.

According to the World Health Organization (WHO), enhancing our surroundings can help prevent about 25% of global diseases. Clean air, stable climates, access to safe drinking water, and effective sanitation are vital for maintaining public health. Our daily interactions with the environment shape our health. Protecting our surroundings is essential to avoid physical, chemical, and biological hazards that can lead to serious illnesses like cancer and asthma.


Raising Awareness and Engaging Communities

World Environmental Health Day aims to boost awareness of these crucial issues. Many universities and colleges organise conferences and workshops to educate young people about environmental challenges. Communities also engage in public events, such as health camps and environmental protection drives, highlighting the significance of environmental health.

Theme for 2024

The theme for this year's observance is "Environmental Health: Creating Resilient Communities through Disaster Risk Reduction and Climate Change Mitigation and Adaptation." This theme underscores the connection between environmental health and climate change. It calls for strong communities ready to face health risks from natural disasters and climate challenges.

As we commemorate this day, let’s take action to protect our planet. By fostering a healthy environment, we can create a brighter, safer future for ourselves and generations to come.

Energy in world economy.


Chapter 1: Energy in the World Economy


https://www.fao.org/4/x8054e/x8054e04.htm#:~:text=Energy%20is%20a%20foundation%20stone,extraction%2C%20industrial%20production%20and%20transportation.


1.1 Introduction

Energy is a foundation stone of the modern industrial economy. Energy provides an essential ingredient for almost all human activities: it provides services for cooking and space/water heating, lighting, health, food production and storage, education, mineral extraction, industrial production and transportation. Modern energy services are a powerful engine of economic and social development, and no country has managed to develop much beyond a subsistence economy without ensuring at least minimum access to energy services for a broad section of its population. Throughout the world, the energy resources available to them and their ability to pay largely determine the way in which people live their lives. Nevertheless, it is critical to recognize that what people want are the services that energy provides, not fuel or electricity per se.

Many factors play a role in influencing energy supply, not least of which are its availability, price and accessibility. The regional endowment of energy sources and the pace at which they are developed and distributed are not uniform around the world. Figure 1.1 shows annual primary energy consumption per capita in various regions of the world (WEC, 1993). The data indicate the wide variation between regions, not solely accounted for by climatic differences. Average world annual consumption at around 1.6 toe/capita; in OECD countries the average is around 5 toe/capita and in developing countries it is less than 1 toe/capita.

Figure 1.1: Primary Annual Energy Consumption per Capita (1990) toe/capita


The last two centuries have seen massive growth in the exploitation and development of energy sources, and the world has gained many benefits from these activities. The magnitude of energy consumed per capita has become one of the indicators of development progress of a country, and as a result, energy issues and policies have been mainly concerned with increasing the supply of energy. This approach is now seen as a vision that needs challenging. Decoupling growth in energy consumption per capita from economic growth and focussing on the appropriate provision of quality energy services to assist economic development is key (UNDP, 1997; UNDP/EC, 1999; and World Bank, 2000b).


1.2 Fuel Types

World primary energy use remains dominated by fossil fuels (coal, oil and natural gas), which account for 75% of total primary energy supply. Renewable energy sources, comprising mainly biomass4 (including fuelwood) and hydropower, currently represent less than 19% of world primary energy use, of which biomass contributes about 14%. Nuclear energy contributes around 6%. Figure 1.2 illustrates these data (BP, 1998).


Figure 1.2: World Primary Energy Use by Fuel Type, 1997 (Gtoe)


The patterns of energy use by fuel type and the way these patterns change over time in developing countries reveal further insights into exploitation of different energy resources. Figures 1.3, 1.4 and 1.5 show estimates of total final energy use by fuel type in Latin America, Asia and Africa respectively over the period from 1980 to 1995 (EC, 1999).


The role of biomass is of particular significance. Biomass use is unevenly distributed around the world: it represents 3% of energy use in industrialized countries and an average of 33% in developing countries, with large differences between regions: biomass covered over 60% of final energy use in Africa, 34% in Asia and 25% in Latin America. Other renewable energy sources, such as small-scale hydropower, geothermal, wind, and solar energy, do not feature as significant energy inputs. Worldwide the aggregated energy supply from these renewable sources amounts to less than 1% of the total. The data also indicate that the proportions of different fuel types changed little in developing countries between 1980 and 1995.


Households and communities in rural areas in developing countries typically rely on diverse sources of energy; using one fuel for heating, another for cooking or lighting and others for agricultural and other productive activities. Most biomass is consumed in traditional ways in the household sector, and is simply collected rather than purchased. Such fuels are locally 'free' in cash terms, but have a cost of much time and physical effort often by children and women. In some rural and urban areas, charcoal has become a cash crop contributing to a monetised economy, and in some urban areas, there are active markets in local woodfuels.


Figure 1.3: Total Final Energy Use in Latin America


Figure 1.4: Total Final Energy Use in Asia


Figure 1.5: Total Final Energy Use in Africa


Because biomass remains such an important fuel around the world, energy policies for developing countries need to be as concerned with the supply and use of biomass, whether in its traditional role or used in modern technology, as they are about fossil fuels or other renewable sources of energy.


1.3 Energy and Development

In developing countries, it is widely accepted that poverty will not be reduced without greater use of modern forms of energy. Surpassing the 1 toe/capita per year level of energy use seems to be an important instrument for development and social change. Whilst low energy consumption is not the only cause of poverty and under-development, it does appear to be a close proxy for many of its causes. For example, environmental degradation, poor health care, inadequate water supplies and female and child hardship are often related to low energy consumption. As an example of this, Figure 1.6 shows life expectancy in 70 developing countries as a function of commercial energy use per capita per year (World Bank, 2000a)5.


Figure 1.6: Life expectancy and energy use per capita


Empirically it appears that social conditions improve considerably as energy consumption per capita increases. Whilst development is a complex process, it is a paradigm of development policy that without appropriate energy services there can be no true economic development. Energy services in suitable forms are essential ingredients for future growth and development.


Even now, around 2 billion people have no access to electricity and rely on traditional fuels, such as dung, crop residues and woodfuel. Another 2 billion have per capita consumption that is barely one-fifth of the average consumer in OECD countries.


The majority of these people lacking access to modern energy services are in the rural areas of developing countries. Bilateral and multilateral development aid in support of national efforts have included a variety of rural energy programmes, including investment projects, training and capacity building, to try to improve the provision of energy services. These include a wide range of activities managed by UNDP, the World Bank, the European Union, FAO and other agencies, together with projects funded via the Global Environment Facility and by bilateral organizations.


Box 1 gives examples of some multilateral programmes undertaken by various UN agencies6, (derived from UNDP/EC, 1999).


Box 1: Examples of energy activities of some UN agencies


Food and Agriculture Organization


FAO assists countries to meet their energy requirements in agriculture, forestry and fisheries as a means of achieving sustainable development. An integrated approach for the assessment, planning and implementation of energy and sustainable rural development is taken via technical assistance activities. The dual role of agriculture as a user and supplier of energy is a major factor in this work. Renewable energy applications are promoted especially in relation to enhanced agricultural productivity and other income generating activities. Networking is promoted, such as the Latin American and Caribbean Working group on Rural Energization for Sustainable Development, the Regional Wood Energy Development Programme in Asia and the Sustainable Rural Environment and Energy Network for the whole European Region.


Bioenergy data and projections are an important component of FAO's energy activities. Attention is also placed on the energy function of the sugar industry, as one of the diversification strategies of that sector, and to the production of low cost transport fuels to contribute to urban food security. FAO has also promoted awareness and better use of work animal technology.


Global Environment Facility


The GEF is an international financing mechanism that provides incremental funding for projects with global environmental benefits. It is also a funding mechanism for the UN Framework Convention on Climate Change and is jointly implemented by UNDP, UNEP and the World Bank. Medium-sized projects up to US$1M, project development activities and enabling activities can be funded via the GEF, and around 40% of funds allocated to date have supported climate change activities comprising energy efficiency and renewable energy projects, assessment and studies.


United Nations Development Programme


UNDP manages several energy-related programmes. Examples of two of these are:


The Initiative for Sustainable Energy (UNISE) is a shift from the traditional supply-side approach, and links energy with social and environmental issues as well as with economic development. Activities are supported through global, regional and national programmes, including technical expertise and training;

The FINESSE programme (Financing Energy Services for Small-scale Energy-users) aims to accelerate the commercialization of renewable energy technologies through pre-investment activities and the creation of the conditions and mechanisms for the credit sector to on-lend to small-scale energy users. FINESSE secures the involvement of small-scale operators, supporting franchise operations and enabling the local manufacture of key components. In Southern Africa, the programme has funded market studies and business plans for investments in projects in biogas, PV, mini-hydro, and solar water heaters. A loan guarantee fund has been supplied to help business plans meet loan conditions.

United Nations Environment Programme

UNEP aims to stimulate cooperation action to respond to emerging environmental challenges and to promote greater awareness and facilitate effective cooperation among all sectors of society and the actors involved in the implementation of the international environmental agenda. The UNEP Energy Policy and Programme focuses on the need for a global shift to less carbon intensive energy systems and through this reduced adverse environmental impacts on local as well as on global levels by promoting:

greater deployment of renewable and non-carbon energy technologies;

efficiency improvements in conventional energy supply and end-use technologies;

provision of better energy services from existing energy systems.

World Bank


The World Bank ESMAP programme (Energy Sector Management and Assistance Programme) provides global technical assistance for the energy sector, including national energy assessments for over 60 countries that have helped pave the way for subsequent capital investment. The Bank has also launched a number of initiatives to encourage private sector investment in renewable energy in developing countries:


The Renewable Energy and Energy Efficiency Fund (REEF), which finances private sector renewable projects of less than 50MW together with energy efficiency activities;

The Solar Development Corporation (SDC), which is a collaboration with a number of foundations, and promotes stand-alone PV systems through private sector mechanisms;

The PV Market Transformation Initiative (PVMTI) is a strategic intervention to accelerate the sustainable commercialization and financial viability of PV technology. PVMTI will make selected concessional investments in private sector PV market development projects in India, Kenya, and Morocco. With technical assistance and appropriately structured financing, these projects are eventually expected to provide successful examples of sustainable and replicable business models that can be financed on a commercial basis.

1.4 Energy Consumption by End-use Sector

Data on energy consumption by end-use sector in developing countries can be used to illustrate further the demand patterns for energy. As an example, Figure 1.7 shows the distribution of primary energy consumption by end-use sector in 10 southern African countries (FAO, 1995). The importance of energy in household use is clear from these data, with 68% of total energy consumption. Industry, transport and agriculture are all relatively small users. This picture is similar in many other developing countries, and contrasts with industrialized countries, where average household energy demand is around 40% of total energy use, and industry and transport are around 30% each.


Figure 1.7: Energy consumption in 10 southern African countries (1990)


1.5 Global Issues in Energy Supply and Demand

Changes in the way that energy is delivered to final consumers are taking place around the world. Energy generation, distribution and supply are moving from the public to the private sectors, and governments are now less likely to be directly involved in managing the energy business. Competition between private utilities is becoming more common, with the government role reducing to one of policy, oversight and regulation. There is also a move away from centrally planned generation and supply, with the market determining operational decisions and the allocation of investment funds. These trends are likely to continue, and are affecting developing and industrialized countries alike, with implications for investment in central power generating capacity and grid extensions.


Projections suggest that energy demand in developing countries will eventually overtake that of industrialized countries. Some forecasts are that on current trends world energy use will grow at 1.4% annually until 2020, with growth in OECD countries of 0.7% and growth in developing countries of 2.6% (WEC, 1995). According to this scenario, developing countries will reach the level of total consumption in OECD countries by 2015, as shown in Figure 1.87, and by 2050, they will have doubled it (WEC, 1995, and World Bank, 1999). Nevertheless, the level of energy consumption per head of population in developing countries will still be only one quarter of that in OECD countries.


Recent assessments from the World Energy Council (WEC, 2000a) have suggested that there are no technological or economic reasons why the world cannot enjoy the benefits of both a high level of energy services and a better environment. One consequence of this is that there is an opportunity for the development of energy services to follow a new path so that developing countries do not repeat the energy demand patterns of industrialized countries. However, a sustainable energy future will require economic, regulatory and institutional frameworks that facilitate appropriate investments, together with proper accounting for social and environmental externalities.


Figure 1.8: Primary Energy Consumption Forecast


Some analysts suggest that the resource base for fossil fuels appears sufficient for there to be less concern than in the 1970s and 1980s about major supply shortages. Resources of both conventional and unconventional oil and gas are thought to be available for another 50-100 years with known technology and at current costs. Coal resources are abundant and should last for more than 100 years. As a result, these analysts affirm that petro-chemicals will remain commercially relevant well into the foreseeable future. However, other analysts observe that oil and gas resources are finite, and that use of these resources are likely to become increasingly reserved for higher value petro-chemical production rather than for fuel supply. This view suggests that the longer-term uncertainties regarding energy supply, together with the forecasts of considerably increased energy demand during the next 50-60 years could produce energy market difficulties in future years. There are also views that suggest that a transition to renewable energy will precede any eventual fossil fuel depletion because of environmental concerns.


Nevertheless, the focus of attention in energy policy is currently being placed on the efficiency by which fossil fuel energy resources are utilized, improving the regulatory and investment framework in which energy is supplied to end-users and tackling the environmental impacts of energy technologies, including their role in climate change. These tend to be the shorter to medium term priorities in energy policy formulation.


1.6 Local Environmental Impacts

The combustion of fossil fuels and traditional woodfuels can create adverse local environmental effects. In developing countries, the local environmental problems associated with energy use remain matters of concern that are as, or even more, urgent than they were in industrialized countries 50 or 100 years ago. Further, it is the poor who suffer most from such problems, because it is they who are forced to rely upon the most inefficient and polluting sources of energy services for lack of access to better alternatives. The connection between woodfuel use, cooking and the epidemiology of respiratory and other illnesses is a topic of active research. Nevertheless, a consistent pattern linking energy, environment and health has become clear (World Bank, 1999). Woodfuel combustion in confined, often unventilated indoor areas and at low thermodynamic efficiency leads to high concentrations of smoke and other pollutants.


The World Bank has estimated that the economic costs of air pollution from all sources are US$ 350B/year, or the equivalent 6% of GNP of all developing countries. Much attention is now being given to technical and policy measures that can reduce the local environmental impact of energy use.


1.7 Climate Change


An issue of much relevance to future energy policy is mitigation of the effects of global climate change. Industrialized countries are responsible for at least 80% of the build-up of greenhouse gases in the atmosphere, and consumption of fossil-fuel derived energy accounts for the largest share of anthropogenic emissions of greenhouse gases. Through the UN Framework Convention on Climate Change and Agenda 21 (UNCED, 1992), the international community has agreed to work together to meet the problems of climate change, and industrialized countries are taking steps to reduce or stabilize their emissions of CO2 and other greenhouse gases.


The implementation of the Kyoto Protocol, once in force, or of any other agreement, which might develop from the Protocol, will greatly influence energy policy, investment decisions and the development and deployment of energy technologies. The Protocol assigns legally binding emission reduction targets and through Joint Implementation and the Clean Development Mechanism, industrialized countries (listed in Annex 1 to the Protocol) can meet part of these targets by financing initiatives to reduce greenhouse gas emissions in other countries. This process may help to lever new financial support for sustainable energy development projects by providing additional benefits to investors (UNDP, 1998). Dealing with climate change will require global efforts to control greenhouse gas emissions. Emissions from developing countries are increasing, and will eventually naturally exceed those of industrialized countries. The means by which economic growth and increased energy demand can be reconciled with protection of the local and global environment is central for future sustainable energy development.


1.8 Energy Security, Diversity of Supply and the Role of Renewable Energy

In simple terms, the concept of diversity of supply means not placing too much reliance on any single fuel, technology or other factor. Ensuring that there is dive


Wednesday, 25 September 2024

India Demographics


 India Demographics

Population of India (2024)

View live population, charts & trends: Population of India

India Population
1,450,935,791
Yearly Change
0.89%
Global Share
17.78%
Global Rank

Median Age

The median age in India is 28.4 years (2024).

Median AgeMedian Age in India(1955-Present)195519852015196519751995200520241618202224262830Median Age

Fertility in India

A Total Fertility Rate (TFR) of 2.1 represents the Replacement-Level Fertility: the average number of children per woman needed for each generation to exactly replace itself without needing international immigration. A value below 2.1 will cause the native population to decline

pregnant_woman Total Fertiliy Rate (TFR)
2.0
(Live Births per Woman, 2024)
Deaths per 1000 live birthsTotal Fertility Rate in India, 1955-Present195519852015196519751995200520241234567Total Fertility Rate (TFR)

Life Expectancy in India

See also: Countries in the world ranked by Life Expectancy

 Both Sexes
72.2 years
(life expectancy at birth, both sexes combined)
 Females
73.9 years
(life expectancy at birth, females)
 Males
70.7 years
(life expectancy at birth, males)
Life Expectancy (Years)Life Expectancy in India from 1955 to PresentMales, Females, and Both Sexes combinedMalesFemalesBoth Sexes19501960197019801990200020102020020406080

Infant Mortality Rate and Deaths of Children under 5 Years Old in India

 Infant Mortality
22.6
(infant deaths per 1,000 live births)
 Deaths under age 5
28.2
(per 1,000 live births)
Deaths per 1000 live birthsInfant and Under Age 5 Mortality Rate in India(per 1000 live births, 1950-Present)195019802010196019701990200020200100200300400Deaths Under Age 5Infant Mortality

India Urban Population

Currently, 36.6 % of the population of India is urban (530,387,142 people in 2024)
Urban PopulationIndia Urban vs. Rural Population from 1955 to 2020Rural PopulationUrban Population195519651975198519952005201520240500M1 000M1 500M2 000M

Population Density

The 2024 population density in India is 488 people per Km2 (1,264 people per mi2), calculated on a total land area of 2,973,190 Km2 (1,147,955 sq. miles).

Largest Cities in India

#CITY NAMEPOPULATION
1Mumbai12,691,836
2Delhi10,927,986
3Bengaluru8,443,675
4Hyderabad6,809,970
5Ahmedabad6,357,693
6Chennai4,681,087
7Kolkata4,631,392
8Surat4,591,246
9Pune3,124,458
10Kanpur2,823,249
11Jaipur2,711,758
12Navi Mumbai2,600,000
13Lucknow2,472,011
14Nagpur2,228,018
15Coimbatore2,136,916
16Indore1,837,041
17Vadodara1,822,221
18Kallakurichi1,682,687
19Patna1,599,920
20Bhopal1,599,914
21Ludhiana1,545,368
22Madurai1,465,625
23Tirunelveli1,435,844
24Agra1,430,055
25Rajkot1,390,640
26Najafgarh1,365,000
27Jamshedpur1,339,438
28Gorakhpur1,324,570
29Nashik1,289,497
30Pimpri1,284,606

See also

Sources

Definitions

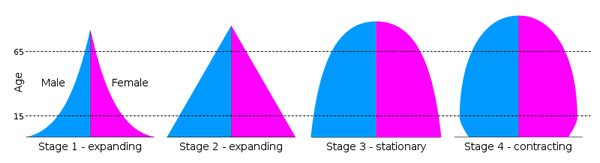
Population Pyramid

A Population pyramid (also called "Age-Sex Pyramid") is a graphical representation of the age and sex of a population.

Types:

  • Expansive - pyramid with a wide base (larger percentage of people in younger age groups, indicating high birth rates and high fertility rates) and narrow top (high death rate and lower life expectancies). It suggests a growing population. Example: Nigera Population Pyramid
  • Constrictive - pyramid with a narrow base (lower percentage of younger people, indicating declining birth rates with each succeeding age group getting smaller than the previous one). Example: United States
  • Stationary - with a somewhat equal proportion of the population in each age group. The population is stable, neither increasing nor decreasing.

Stages:


Dependency Ratio

There are three types of age dependency ratio: Youth, Elderly, and Total. All three ratios are commonly multiplied by 100.

Youth Dependency Ratio
Definition: population ages 0-15 divided by the population ages 16-64.
Formula: ([Population ages 0-15] ÷ [Population ages 16-64]) × 100

Elderly dependency ratio
Definition: population ages 65-plus divided by the population ages 16-64.
Formula: ([Population ages 65-plus] ÷ [Population ages 16-64]) × 100

Total dependency ratio
Definition: sum of the youth and old-age ratios.
Formula: (([Population ages 0-15] + [Population ages 65-plus]) ÷ [Population ages 16-64]) × 100

NOTE: Dependency Ratio does not take into account labor force participation rates by age group. Some portion of the population counted as "working age" may actually be unemployed or not in the labor force whereas some portion of the "dependent" population may be employed and not necessarily economically dependent.