Monday, 30 November 2020

Urea fertilizers


Urea fertilizers

Urea fertilizers are widely used in agriculture. They are considered an economic nitrogen source.

The chemical formula of urea is CO(NH2)2 and, in nature, urea is excreted in the urine of mammals. Commercial urea fertilizers are produced by reacting ammonia with carbon dioxide.

In its solid form, urea is provided as either prills or granules. Granules are slightly larger than prills and are more dense. Both prilled and granular urea fertilizers contain 46% N.

Nitrogen leaching and volatilization rates are usually higher when using the prilled form. Therefore, granular urea fertilizers are 15-20% more efficient than prilled.

Urea fertilizers are highly soluble (solubility of 1079 g/L at 20ºC). Therefore, in addition to soil applications, urea fertilizers can be also used in fertigation or as a foliar application. However, urea fertilizers should not be used in soilless culture, as urea will immediately leach out of the container.

The NPK grade of a solid urea fertilizer is 46-0-0.  Another fertilizer containing high concentration of urea is Urea Ammonium Nitrate (UAN). UAN is a liquid fertilizer containing between 28 and 32% nitrogen. 50% of the nitrogen is urea, 25% ammonium nitrogen and 25% nitrate nitrogen.


REACTIONS OF UREA FERTILIZERS IN SOIL

Plants cannot absorb urea nitrogen. In order for the plant to absorb nitrogen applied as urea, nitrogen must be converted into ammonium (NH4+) and nitrate (NO3), which are the nitrogen forms that plants can use.

Once applied, the urea fertilizer reacts with water in the soil and with urease, an enzyme that exists abundantly in soils, and goes through the hydrolysis process, in which urea is converted into ammonium carbonate.

Ammonium carbonate is then converted into ammonium or to ammonia gas (NH3), depending on conditions such as pH, temperature and soil moisture.

Ammonia gas readily volatilizes from the soil and, as a result, significant losses of nitrogen may occur if conditions favor formation of ammonia rather than ammonium.

High soil pH and temperature result in greater losses of nitrogen.

Soil pH – High soil pH increases the rate of volatilization, as more ammonium is converted into ammonia gas.

Soil temperature – high soil temperatures increase the rate of urea hydrolysis, as it increases the activity of urease. At 70ºC urease becomes inactive due to denaturation.

The hydrolysis reaction is as follows:

(NH2)2CO + 2H2O –> (NH4)2CO3

(NH4)2CO3 + H2O –> 2NH3 + 2H2O + CO2

NH3 + H2 –> NH4+ +OH(ammonification)

2NH4+ + 4O2 –> 2NO3 +4H++2H2O (nitrification)

As can be noted from the equation, the application of urea fertilizers results in an initial increase in the soil pH around the applied fertilizer, as hydrogen ions are consumed. However, the nitrification of ammonium to nitrate, which is carried out by soil bacteria, results in an a slightly acidifying net effect.


MOBILITY OF UREA FERTILIZERS IN SOIL

Since urea molecule is not electrically charged, it readily moves in soil.  Leaching of nitrogen as urea will depend, therefore, on soil humidity and the time until urea hydrolysis is complete. Once urea is converted to ammonium, leaching reduces, because ammonium, which carries a positive charge, attracts to the negatively charged particles of the soil and, therefore, is relatively immobile.

Urea is more mobile than ammonium but a bit less mobile than nitrate.

Plant nutrition book by Guy SelaLearn more

GUIDELINES FOR APPLICATION OF UREA FERTILIZERS

Urea fertilizers should be applied carefully. If not applied correctly, nitrogen losses due to volatilization may occur and, in some cases, urea might cause damage to germinating seeds.

Urea should be incorporated into the soil by irrigation or rainfall soon after its application.  Application of urea fertilizers to the soil surface without incorporating them into the soil results in greater losses of nitrogen. Losses are greater in soils of high pH.

Urea fertilizers should be applied when temperature is not too low or too high. Soil temperatures of 15- 20°C (70°F) are considered adequate.

Using urea fertilizers with urease inhibitors – urease inhibitors reduce the rate of hydrolysis and, therefore, of ammonia production and volatilization. This allows additional one or two weeks for incorporating the urea fertilizer into the soil by rain, irrigation or other means.

Urea fertilizers containing biuret – biuret is a chemical compound with the formula  [H2NC(O)]2NH, which is formed in the manufacturing process of urea fertilizers. In high concentrations biuret might be toxic to crops.

Most urea fertilizers contain 1.0 to 1.3% biuret, which is considered safe to use. However, some crops are more sensitive. For foliar applications on sensitive crops, low-biuret fertilizers (contain approximately 0.25% biuret) should be used. Biuret might also damage seedlings if the urea fertilizer is placed too close to germinating seeds.

HAPPY FOUNDER'S DAY


DEAR ALL

                                HAPPY FOUNDER'S DAY


PRCC


Sunday, 29 November 2020

SO 9001, 14001, 45001 (IMS) basics training material

 Why this training is required ?
when already materials standards available?
OBJECTIVE – Success of any activity purely dep...

 What is Management??
MANAGEMENT:
The planning, organizing, leading, and
controlling of human and other resources
to achiev...


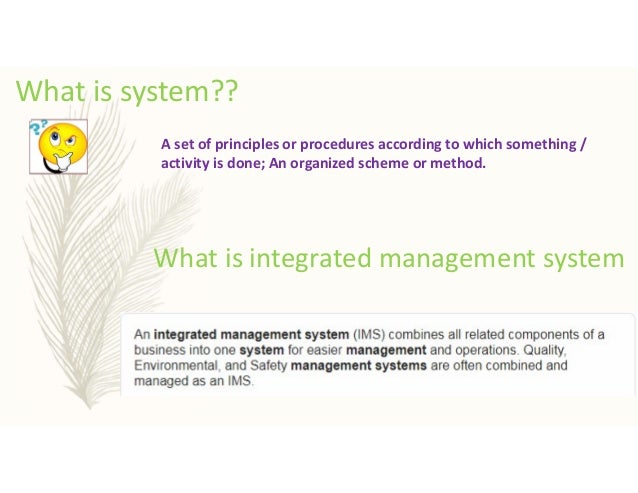
 What is system??
A set of principles or procedures according to which something /
activity is done; An organized scheme or...


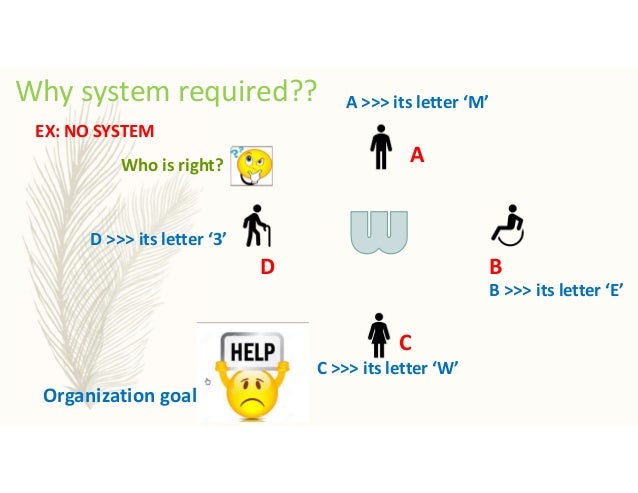
 Why system required??
A
B
C
D
EX: NO SYSTEM
D >>> its letter ‘3’
Who is right?
A >>> its letter ‘M’
B >>> its letter ‘E’
C...


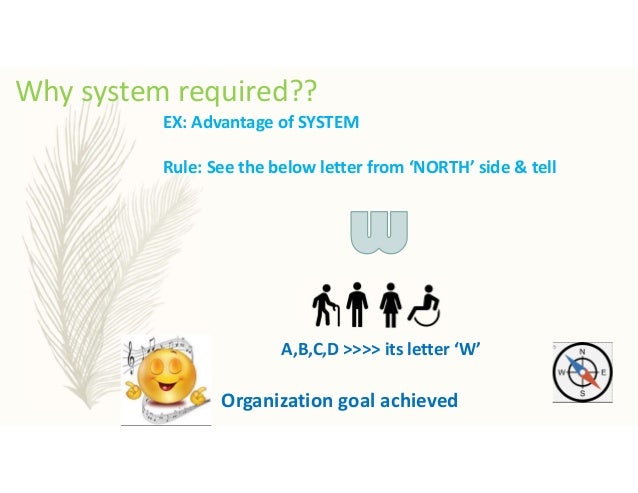
 Why system required??
EX: Advantage of SYSTEM
Rule: See the below letter from ‘NORTH’ side & tell
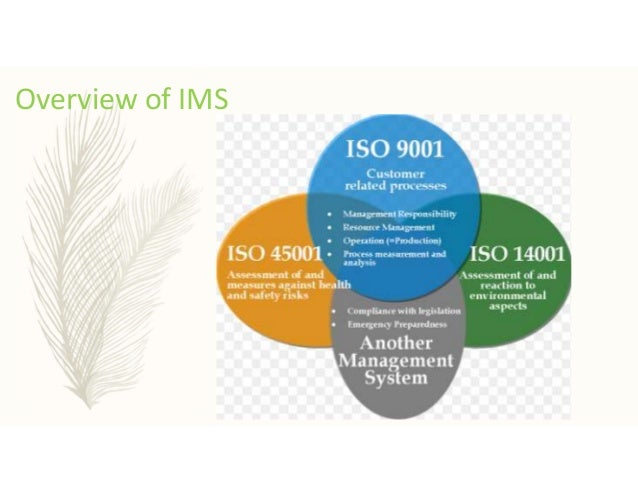
A,B,C,D >>>> its letter ...Overview of IMS

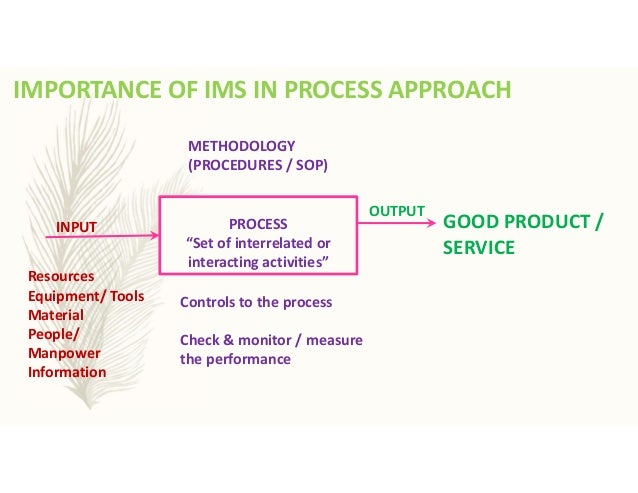
IMPORTANCE OF IMS IN PROCESS APPROACH
PROCESS
“Set of interrelated or
interacting activities”
INPUT
OUTPUT
METHODOLOGY
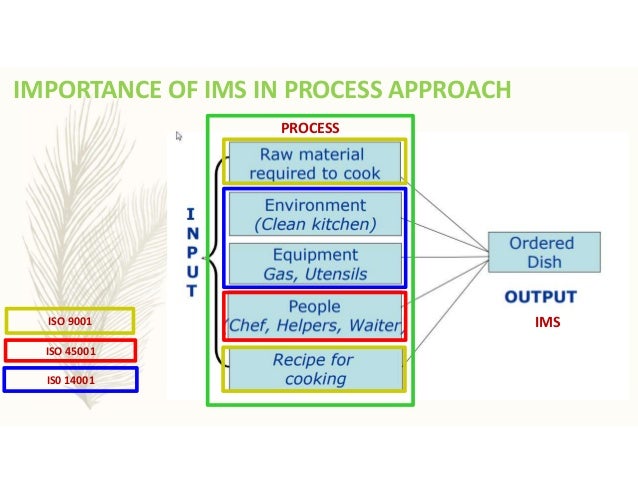
(PR...IMPORTANCE OF IMS IN PROCESS APPROACH
ISO 9001
ISO 45001
IS0 14001
PROCESS
IMS
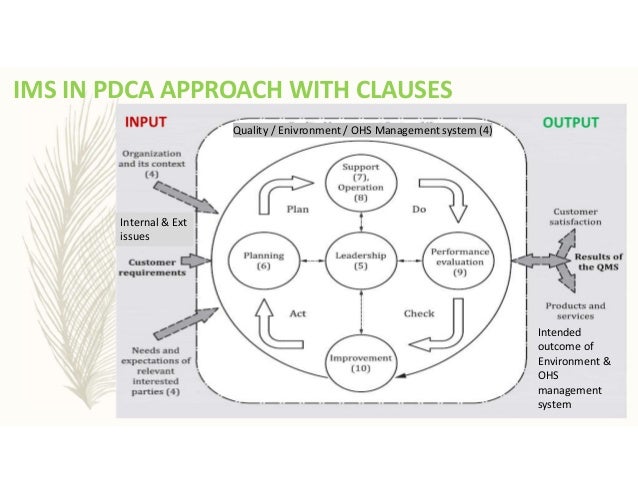
 IMS IN PDCA APPROACH WITH CLAUSES
Quality / Enivronment / OHS Management system (4)
Intended
outcome of
Environment &
OHS
... 

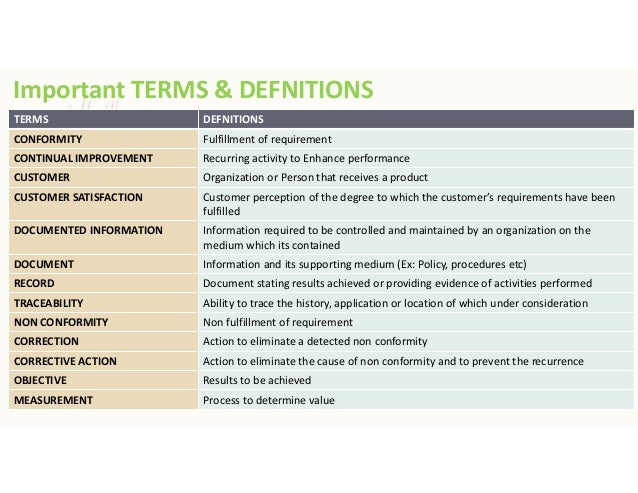
 Important TERMS & DEFNITIONS
TERMS DEFNITIONS
CONFORMITY Fulfillment of requirement
CONTINUAL IMPROVEMENT Recurring activi...IMS Clause comparison
Clause
Number
ISO 450001:2018 ISO 9001:2015 ISO 14001:2015
1 1SCOPE 1SCOPE 1SCOPE
2 2NORMATIVE REFER...Important TERMS & DEFNITIONS
ENVIRONMENT:
Surroundings in which an organization operates including air, water, land , natu...


IMS Clause comparison contd
8 8 OPERATION (Title) 8 OPERATION (Title) 8 OPERATION (Title)
8.1 Operational planning and con...

IMS Clause comparison contd
9 9PERFORMANCE EVALUATION(Title) 9PERFORMANCE EVALUATION (Title) 9PERFORMANCE EVALUATION(Title...Advantage of IMS is TEN common elements
 IMS requirements

List of mandatory requirements
Document
Information and its supporting medium
Record
Document stating results achieved or ...


List of mandatory requirements ISO 9001:2015

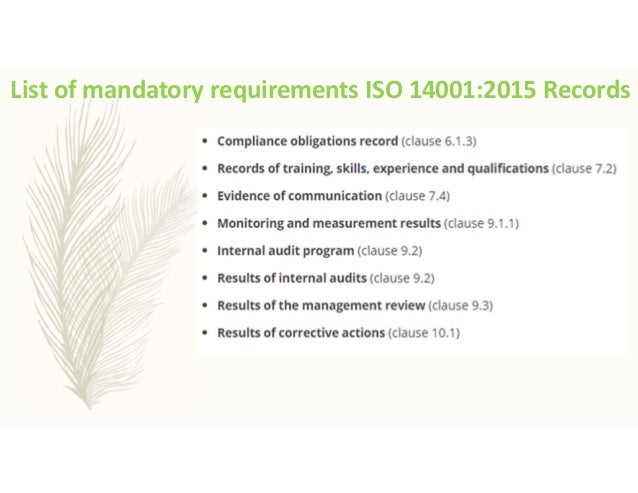
 List of mandatory requirements ISO 14001:2015 Records
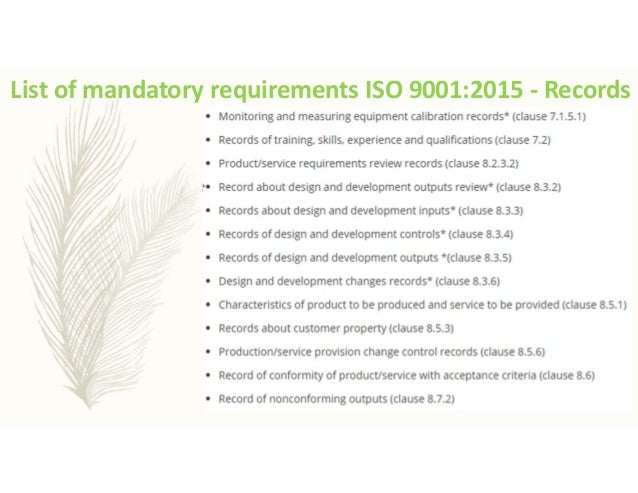
 List of mandatory requirements ISO 9001:2015 - Records

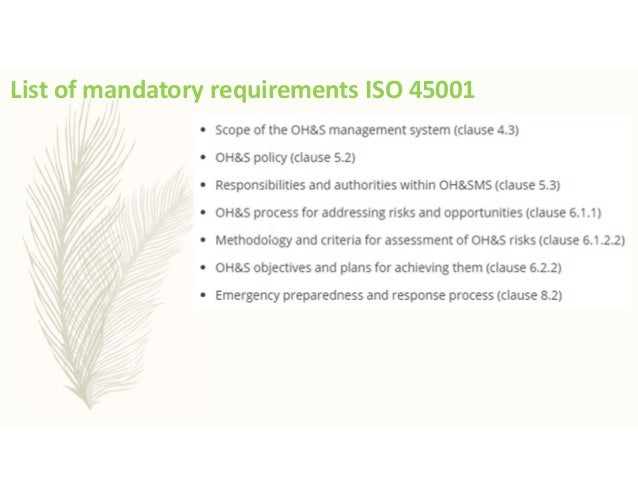
List of mandatory requirements ISO 45001
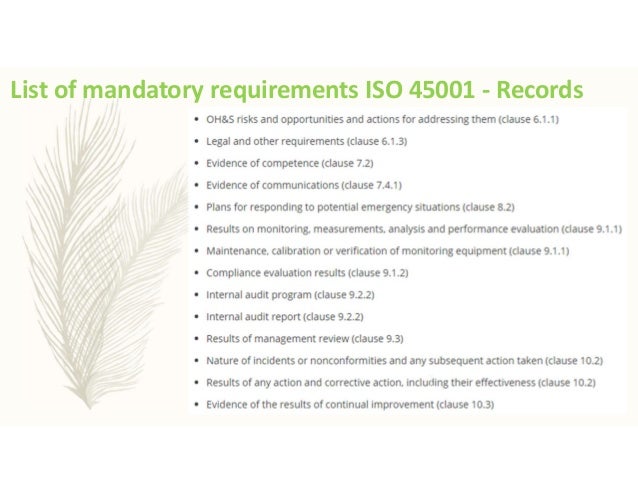
 List of mandatory requirements ISO 45001 - Records
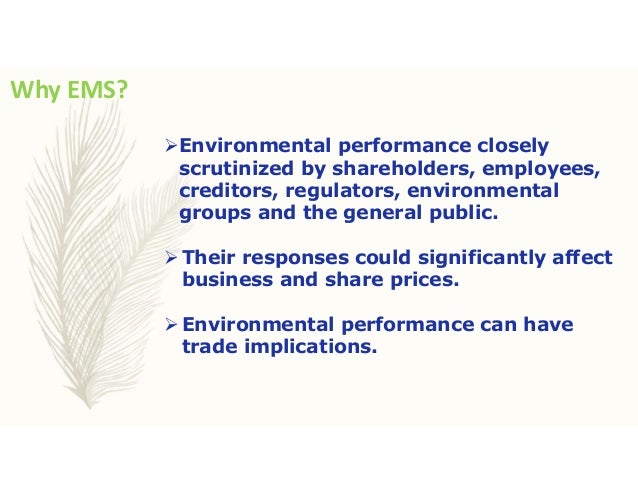
 Why EMS?
Environmental performance closely
scrutinized by shareholders, employees,
creditors, regulators, environmental
g...Why H&S?
 The total losses attributable to illness
& injury is often quantified by the
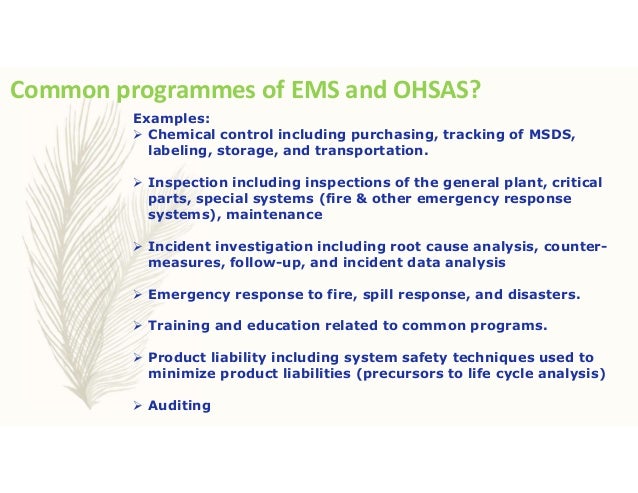
organizations, but its just tip of...Common programmes of EMS and OHSAS?
Examples:
 Chemical control including purchasing, tracking of MSDS,
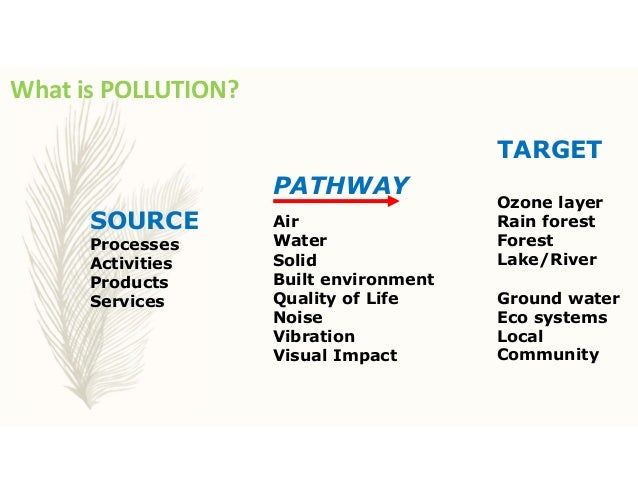
labeling, storage...What is POLLUTION?
SOURCE
Processes
Activities
Products
Services
PATHWAY
Air
Water
Solid
Built environment
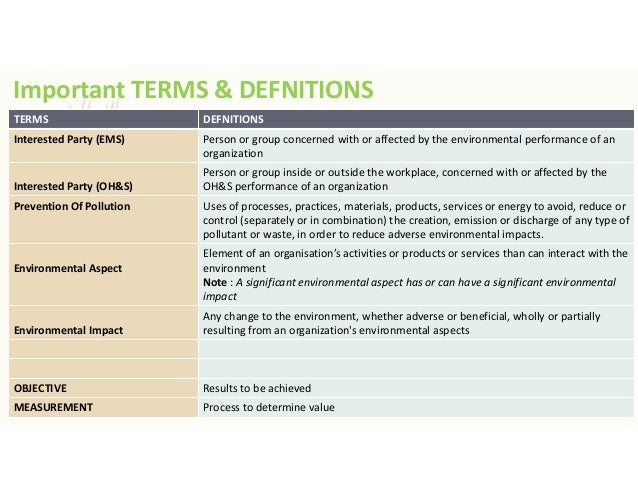
Quality of Life...Important TERMS & DEFNITIONS
TERMS DEFNITIONS
Interested Party (EMS) Person or group concerned with or affected by the env...ENVIRONMENTAL PROBLEMS?
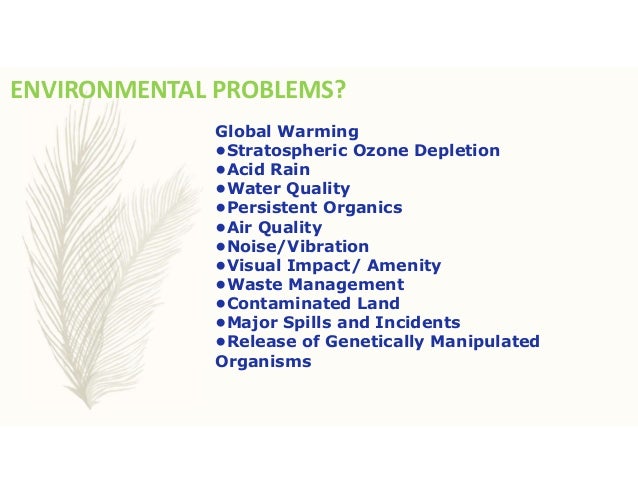
Global Warming
•Stratospheric Ozone Depletion
•Acid Rain
•Water Quality
•Persistent Organics
•Air ...ASPECT & IMPACT?
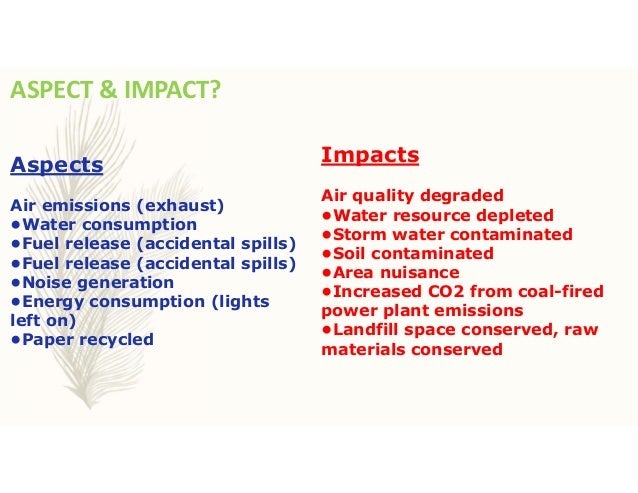
Aspects
Air emissions (exhaust)
•Water consumption
•Fuel release (accidental spills)
•Fuel release (accid...LEGAL & OTHER REQUIREMENTS
Procedures to identify and access
applicable legal & other requirements
• Keep information up t...LEGAL & OTHER REQUIREMENTS
The statutes relating to OH&S are
broadly divided into three:-
• Statutes for safety at workpla...LEGAL REQUIREMENTS
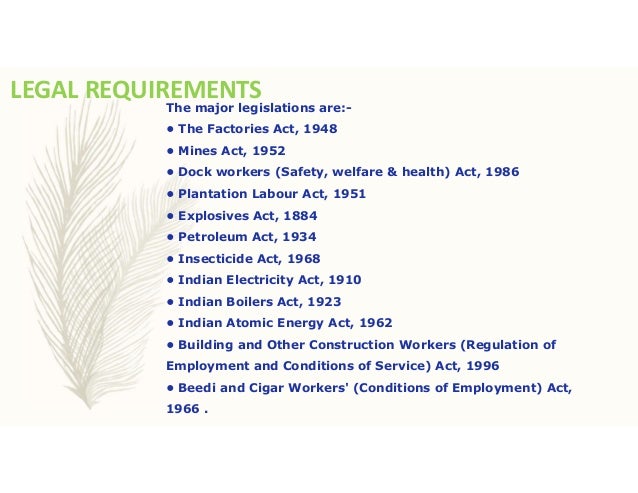
The major legislations are:-
• The Factories Act, 1948
• Mines Act, 1952
• Dock workers (Safety, welfar...SO 9001, 14001, 45001 (IMS) basics training material

Published on


amarnathgiri3
  • Be the first to comment

ISO 9001, 14001, 45001 (IMS) basics training material

  1. 1. Awarness training on IMS system ISO 9001:2015, ISO 14001: 2015 & ISO 45001:2018. PREPARED: R.RANGANATHAN
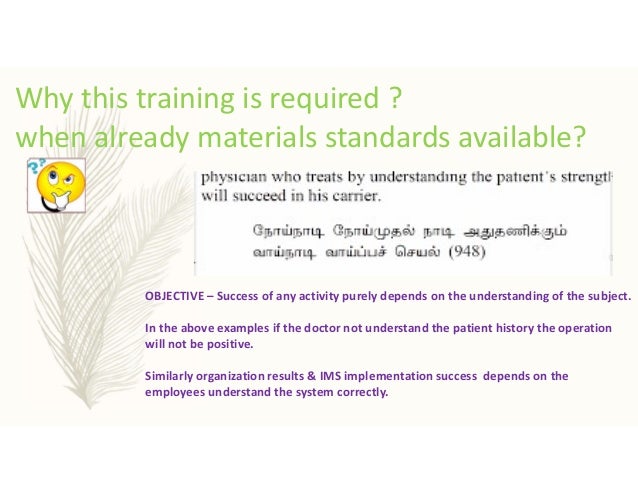
  2. 2. Why this training is required ? when already materials standards available? OBJECTIVE – Success of any activity purely depends on the understanding of the subject. In the above examples if the doctor not understand the patient history the operation will not be positive. Similarly organization results & IMS implementation success depends on the employees understand the system correctly.
  3. 3. What is Management?? MANAGEMENT: The planning, organizing, leading, and controlling of human and other resources to achieve organizational goals effectively and efficiently
  4. 4. What is system?? A set of principles or procedures according to which something / activity is done; An organized scheme or method. What is integrated management system
  5. 5. Why system required?? A B C D EX: NO SYSTEM D >>> its letter ‘3’ Who is right? A >>> its letter ‘M’ B >>> its letter ‘E’ C >>> its letter ‘W’ Organization goal
  6. 6. Why system required?? EX: Advantage of SYSTEM Rule: See the below letter from ‘NORTH’ side & tell A,B,C,D >>>> its letter ‘W’ Organization goal achieved
  7. 7. Overview of IMS
  8. 8. Overview of IMS ISO 9001 ISO 14001 ISO 45001 TALKS ABOUT QUALITY MANAGEMENT SYSTEM TALKS ABOUT ENVIRONMENT MANAGEMENT SYSTEM TALKS ABOUT HEALTH & SAFETY MANAGEMENT SYSTEM IMPROVE OVER ALL ORGANIZATION PERFORMANCE & PROVIDE SUSTAINABLE DEVELOPMENTS PROTECT ENVIRONMENT, PREVENT OR MITIGATE ADVERSE ENVIRONMENT IMPACTS IT ENABLES TO PROVIDE SAFE & HEALTHY WORKPLACE, PREVENT WORK RELATED INJURY & ILL HELATH AND CONTINUALLY IMPROVE OHS PERFORMANCE CONSITENTLY PROVIDE PRODUCT & SERVICE TO MEET CUSTOMER, STATUATORY AND REGULATORY REQUIREMENTS FULFILLMENT OF COMPLAINCE OBLIGATIONS IT HELPS TO FULL FILL LEAGAL REQUIREMENTS & OTHER REQUIREMENTS ENHACE CUSTOMER SATISFACTION ENHANCE ENVIRONMENT PERFORMANCE IT IMPROVES OHS PERFORMANCE ADRESS RISK AND OPPORTUNITIES ASSOCIATED WITH ITS CONTEXT AND BUSINESS OBJECTIVES ACHIEVE ENVIRONMENT OBJECTIVES ELIMINATE HAZARDS & MINIMIZE OHS RISK BY EFFECTIVE PREVENTIVE MEASURES
  9. 9. IMPORTANCE OF IMS IN PROCESS APPROACH PROCESS “Set of interrelated or interacting activities” INPUT OUTPUT METHODOLOGY (PROCEDURES / SOP) Controls to the process Check & monitor / measure the performance Resources Equipment/ Tools Material People/ Manpower Information GOOD PRODUCT / SERVICE
  10. 10. IMPORTANCE OF IMS IN PROCESS APPROACH ISO 9001 ISO 45001 IS0 14001 PROCESS IMS
  11. 11. IMS IN PDCA APPROACH WITH CLAUSES Quality / Enivronment / OHS Management system (4) Intended outcome of Environment & OHS management system Internal & Ext issues
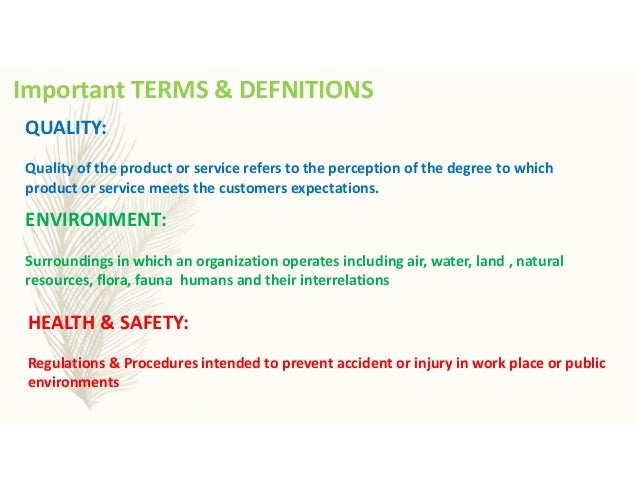
  12. 12. Important TERMS & DEFNITIONS ENVIRONMENT: Surroundings in which an organization operates including air, water, land , natural resources, flora, fauna humans and their interrelations QUALITY: Quality of the product or service refers to the perception of the degree to which product or service meets the customers expectations. HEALTH & SAFETY: Regulations & Procedures intended to prevent accident or injury in work place or public environments
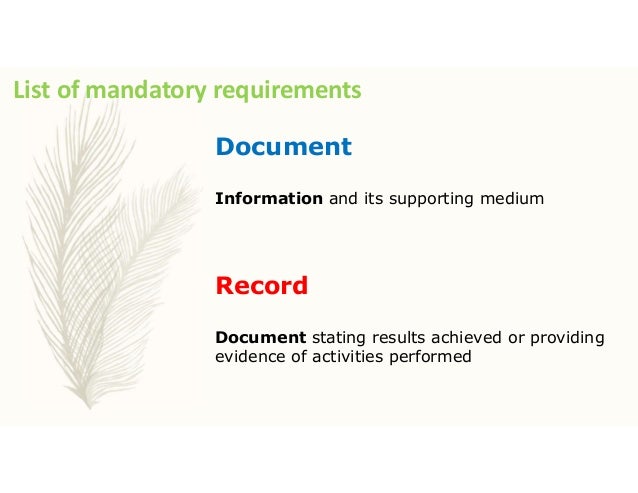
  13. 13. Important TERMS & DEFNITIONS TERMS DEFNITIONS CONFORMITY Fulfillment of requirement CONTINUAL IMPROVEMENT Recurring activity to Enhance performance CUSTOMER Organization or Person that receives a product CUSTOMER SATISFACTION Customer perception of the degree to which the customer’s requirements have been fulfilled DOCUMENTED INFORMATION Information required to be controlled and maintained by an organization on the medium which its contained DOCUMENT Information and its supporting medium (Ex: Policy, procedures etc) RECORD Document stating results achieved or providing evidence of activities performed TRACEABILITY Ability to trace the history, application or location of which under consideration NON CONFORMITY Non fulfillment of requirement CORRECTION Action to eliminate a detected non conformity CORRECTIVE ACTION Action to eliminate the cause of non conformity and to prevent the recurrence OBJECTIVE Results to be achieved MEASUREMENT Process to determine value
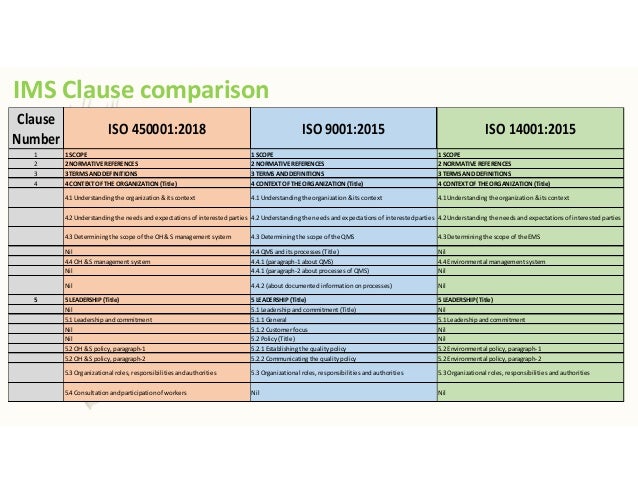
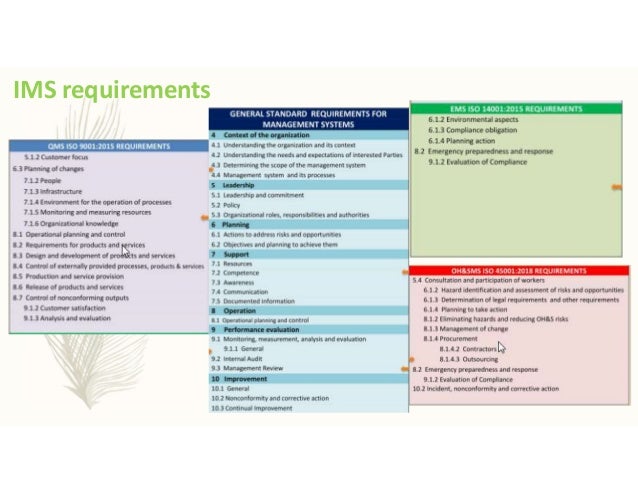
  14. 14. IMS Clause comparison Clause Number ISO 450001:2018 ISO 9001:2015 ISO 14001:2015 1 1SCOPE 1SCOPE 1SCOPE 2 2NORMATIVE REFERENCES 2NORMATIVE REFERENCES 2NORMATIVE REFERENCES 3 3TERMS AND DEFINITIONS 3TERMS ANDDEFINITIONS 3TERMS AND DEFINITIONS 4 4CONTEXTOF THE ORGANIZATION (Title) 4CONTEXT OF THE ORGANIZATION (Title) 4CONTEXTOF THE ORGANIZATION (Title) 4.1 Understanding the organization & its context 4.1 Understanding the organization & its context 4.1Understanding the organization & its context 4.2 Understanding the needs and expectations of interested parties 4.2 Understanding the needs and expectations of interested parties 4.2Understanding the needs and expectations of interested parties 4.3 Determining the scope of the OH & S management system 4.3 Determining the scope of the QMS 4.3Determining the scope of the EMS Nil 4.4 QMS and its processes (Title) Nil 4.4 OH & S management system 4.4.1(paragraph-1about QMS) 4.4Environmental management system Nil 4.4.1(paragraph-2about processes of QMS) Nil Nil 4.4.2 (about documented information on processes) Nil 5 5LEADERSHIP (Title) 5LEADERSHIP (Title) 5LEADERSHIP (Title) Nil 5.1 Leadership and commitment (Title) Nil 5.1 Leadership and commitment 5.1.1General 5.1Leadership and commitment Nil 5.1.2Customer focus Nil Nil 5.2 Policy (Title) Nil 5.2 OH & S policy, paragraph-1 5.2.1Establishing the quality policy 5.2Environmental policy, paragraph-1 5.2 OH & S policy, paragraph-2 5.2.2Communicating the quality policy 5.2Environmental policy, paragraph-2 5.3 Organizational roles, responsibilities and authorities 5.3 Organizational roles, responsibilities and authorities 5.3Organizational roles, responsibilities and authorities 5.4 Consultation and participation of workers Nil Nil
  15. 15. IMS Clause comparison contd 6 6 PLANNING (Title) 6 PLANNING (Title) 6 PLANNING (Title) 6.1 Actions to address risks & opportunities (Title) 6.1 Actions to address risks & opportunities (Title) 6.1 Actions to address risks & opportunities (Title) 6.1.1 General 6.1.1 (about requirements when planning QMS) 6.1.1 General Nil 6.1.2 (about addressing risks & opportunities) Nil 6.1.2 Hazard Identification and assessment of risks and opportunities Nil 6.1.2 Environmental aspects 6.1.3 Determination of legal requirements and other requirements Nil 6.1.3 Compliance obligations 6.1.4 Planning action Nil 6.1.4 Planning action 6.2 OH & S objectives and planning to achieve them (Title) 6.2 Quality objectives and planning to achieve them (Title) 6.2 Environmental objectives and planning to achieve them (Title) 6.2.1 OH & S objectives 6.2.1 (about quality objectives) 6.2.1 Environmental objectives 6.2.2 Planning actions to achieve OH & S objectives 6.2.2 (about achievement planning) 6.2.2 Planning actions to achieve environmental objectives 8.1.3 Management of change 6.3 Planning of changes Nil 7 7 SUPPORT (Title) 7 SUPPORT (Title) 7 SUPPORT (Title) Nil 7.1 Resources (Title) Nil 7.1 Resources 7.1.1 General 7.1 Resources Nil 7.1.2 People Nil Nil 7.1.3 Infrastructure Nil Nil 7.1.4 Environment for the operation of processes Nil Nil 7.1.5 Monitoring and measuring resources (Title) Nil Nil 7.1.5.1 General Nil Nil 7.1.5.2 Measuring traceability Nil Nil 7.1.6 Organizational knowledge Nil 7.2 Competence 7.2 Competence 7.2 Competence 7.3 Awareness 7.3 Awareness 7.3 Awareness 7.4 Communication (Title) Nil 7.4 Communication (Title) 7.4.1 General 7.4 Communication 7.4.1 General 7.4.2 Internal Communication Nil 7.4.2 Internal Communication 7.4.3 External Communication 7.4.3 External Communication 7.5 Documented information (Title) 7.5 Documented information (Title) 7.5 Documented information (Title) 7.5.1 General 7.5.1 General 7.5.1 General 7.5.2 Creating and updating 7.5.2 Creating and updating 7.5.2 Creating and updating Nil 7.5.3 Control of documented information (Title) Nil 7.5.3 Control of documented information, paragraph-1 7.5.3.1 (about purpose of control) 7.5.3 Control of documented information, paragraph-1 7.5.3 Control of documented information, paragraph-2 & 3 7.5.3.2 (about requirements for control) 7.5.3 Control of documented information, paragraph-2 & 3
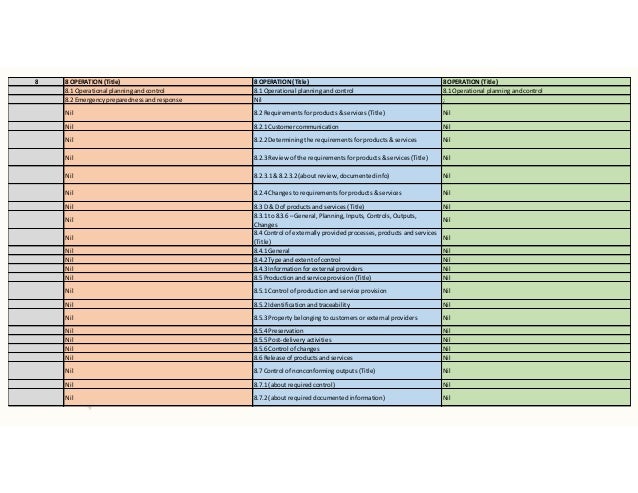
  16. 16. IMS Clause comparison contd 8 8 OPERATION (Title) 8 OPERATION (Title) 8 OPERATION (Title) 8.1 Operational planning and control 8.1 Operational planning and control 8.1 Operational planning and control 8.2 Emergency preparedness and response Nil ; Nil 8.2 Requirements for products & services (Title) Nil Nil 8.2.1 Customer communication Nil Nil 8.2.2 Determining the requirements for products & services Nil Nil 8.2.3 Review of the requirements for products & services (Title) Nil Nil 8.2.3.1 & 8.2.3.2 (about review, documented info) Nil Nil 8.2.4 Changes to requirements for products & services Nil Nil 8.3 D & D of products and services (Title) Nil Nil 8.3.1 to 8.3.6 – General, Planning, Inputs, Controls, Outputs, Changes Nil Nil 8.4 Control of externally provided processes, products and services (Title) Nil Nil 8.4.1 General Nil Nil 8.4.2 Type and extent of control Nil Nil 8.4.3 Information for external providers Nil Nil 8.5 Production and service provision (Title) Nil Nil 8.5.1 Control of production and service provision Nil Nil 8.5.2 Identification and traceability Nil Nil 8.5.3 Property belonging to customers or external providers Nil Nil 8.5.4 Preservation Nil Nil 8.5.5 Post-delivery activities Nil Nil 8.5.6 Control of changes Nil Nil 8.6 Release of products and services Nil Nil 8.7 Control of nonconforming outputs (Title) Nil Nil 8.7.1 (about required control) Nil Nil 8.7.2 (about required documented information) Nil
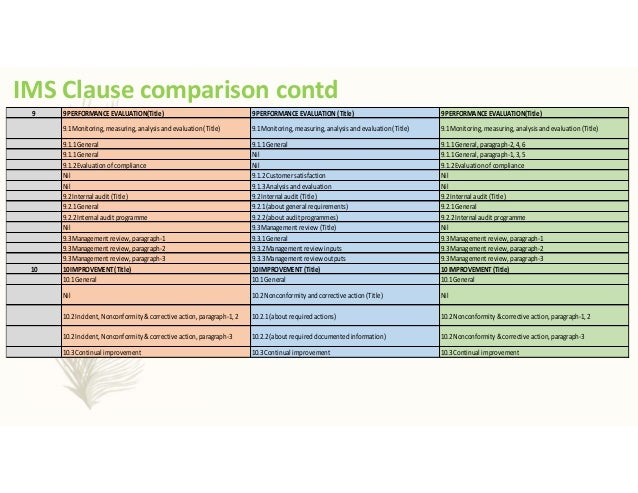
  17. 17. IMS Clause comparison contd 9 9PERFORMANCE EVALUATION(Title) 9PERFORMANCE EVALUATION (Title) 9PERFORMANCE EVALUATION(Title) 9.1Monitoring, measuring, analysis and evaluation (Title) 9.1Monitoring, measuring, analysis and evaluation (Title) 9.1Monitoring, measuring, analysis and evaluation (Title) 9.1.1General 9.1.1General 9.1.1General, paragraph-2, 4, 6 9.1.1General Nil 9.1.1General, paragraph-1, 3, 5 9.1.2Evaluation of compliance Nil 9.1.2Evaluation of compliance Nil 9.1.2Customer satisfaction Nil Nil 9.1.3Analysis and evaluation Nil 9.2Internal audit (Title) 9.2Internal audit (Title) 9.2Internal audit (Title) 9.2.1General 9.2.1(about general requirements) 9.2.1General 9.2.2Internal audit programme 9.2.2(about audit programmes) 9.2.2Internal audit programme Nil 9.3Management review (Title) Nil 9.3Management review, paragraph-1 9.3.1General 9.3Management review, paragraph-1 9.3Management review, paragraph-2 9.3.2Management review inputs 9.3Management review, paragraph-2 9.3Management review, paragraph-3 9.3.3Management review outputs 9.3Management review, paragraph-3 10 10IMPROVEMENT(Title) 10IMPROVEMENT(Title) 10IMPROVEMENT(Title) 10.1General 10.1General 10.1General Nil 10.2Nonconformity and corrective action (Title) Nil 10.2Incident, Nonconformity & corrective action, paragraph-1, 2 10.2.1(about required actions) 10.2Nonconformity & corrective action, paragraph-1, 2 10.2Incident, Nonconformity & corrective action, paragraph-3 10.2.2(about required documented information) 10.2Nonconformity & corrective action, paragraph-3 10.3Continual improvement 10.3Continual improvement 10.3Continual improvement
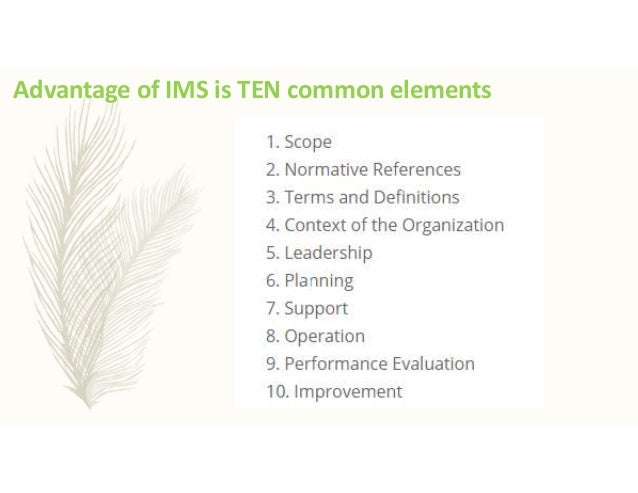
  18. 18. Advantage of IMS is TEN common elements
  19. 19. IMS requirements
  20. 20. List of mandatory requirements Document Information and its supporting medium Record Document stating results achieved or providing evidence of activities performed
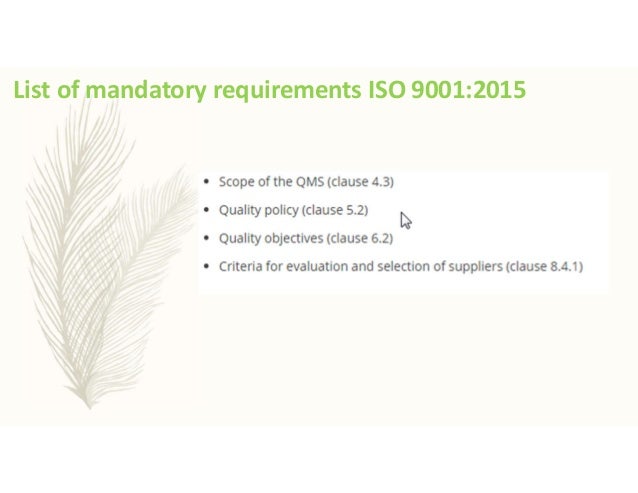
  21. 21. List of mandatory requirements ISO 9001:2015
  22. 22. List of mandatory requirements ISO 9001:2015 - Records
  23. 23. List of mandatory requirements ISO 14001:2015
  24. 24. List of mandatory requirements ISO 14001:2015 Records
  25. 25. List of mandatory requirements ISO 45001
  26. 26. List of mandatory requirements ISO 45001 - Records
  27. 27. Why EMS? Environmental performance closely scrutinized by shareholders, employees, creditors, regulators, environmental groups and the general public.  Their responses could significantly affect business and share prices.  Environmental performance can have trade implications.
  28. 28. Why H&S?  The total losses attributable to illness & injury is often quantified by the organizations, but its just tip of the ice berg  Losses due to building and plant damage, replacement cost etc. amount from 6 to 53 times loss incurred through injury and illness are hidden beneath the surface
  29. 29. Common programmes of EMS and OHSAS? Examples:  Chemical control including purchasing, tracking of MSDS, labeling, storage, and transportation.  Inspection including inspections of the general plant, critical parts, special systems (fire & other emergency response systems), maintenance  Incident investigation including root cause analysis, counter- measures, follow-up, and incident data analysis  Emergency response to fire, spill response, and disasters.  Training and education related to common programs.  Product liability including system safety techniques used to minimize product liabilities (precursors to life cycle analysis)  Auditing
  30. 30. Important TERMS & DEFNITIONS TERMS DEFNITIONS Interested Party (EMS) Person or group concerned with or affected by the environmental performance of an organization Interested Party (OH&S) Person or group inside or outside the workplace, concerned with or affected by the OH&S performance of an organization Prevention Of Pollution Uses of processes, practices, materials, products, services or energy to avoid, reduce or control (separately or in combination) the creation, emission or discharge of any type of pollutant or waste, in order to reduce adverse environmental impacts. Environmental Aspect Element of an organisation’s activities or products or services than can interact with the environment Note : A significant environmental aspect has or can have a significant environmental impact Environmental Impact Any change to the environment, whether adverse or beneficial, wholly or partially resulting from an organization's environmental aspects OBJECTIVE Results to be achieved MEASUREMENT Process to determine value
  31. 31. What is POLLUTION? SOURCE Processes Activities Products Services PATHWAY Air Water Solid Built environment Quality of Life Noise Vibration Visual Impact TARGET Ozone layer Rain forest Forest Lake/River Ground water Eco systems Local Community
  32. 32. ENVIRONMENTAL PROBLEMS? Global Warming •Stratospheric Ozone Depletion •Acid Rain •Water Quality •Persistent Organics •Air Quality •Noise/Vibration •Visual Impact/ Amenity •Waste Management •Contaminated Land •Major Spills and Incidents •Release of Genetically Manipulated Organisms
  33. 33. ASPECT & IMPACT? Aspects Air emissions (exhaust) •Water consumption •Fuel release (accidental spills) •Fuel release (accidental spills) •Noise generation •Energy consumption (lights left on) •Paper recycled Impacts Air quality degraded •Water resource depleted •Storm water contaminated •Soil contaminated •Area nuisance •Increased CO2 from coal-fired power plant emissions •Landfill space conserved, raw materials conserved
  34. 34. LEGAL & OTHER REQUIREMENTS Procedures to identify and access applicable legal & other requirements • Keep information up to date • Communicate requirements to :- – employees - Person working under the control of organisation – interested parties
  35. 35. LEGAL & OTHER REQUIREMENTS The statutes relating to OH&S are broadly divided into three:- • Statutes for safety at workplaces • Statutes for safety of substances • Statutes for safety of activities
  36. 36. LEGAL REQUIREMENTS The major legislations are:- • The Factories Act, 1948 • Mines Act, 1952 • Dock workers (Safety, welfare & health) Act, 1986 • Plantation Labour Act, 1951 • Explosives Act, 1884 • Petroleum Act, 1934 • Insecticide Act, 1968 • Indian Electricity Act, 1910 • Indian Boilers Act, 1923 • Indian Atomic Energy Act, 1962 • Building and Other Construction Workers (Regulation of Employment and Conditions of Service) Act, 1996 • Beedi and Cigar Workers' (Conditions of Employment) Act, 1966 .
  37. 37. THANK YOU QUESTIONS AND FEEDBACK Ranganathan Radhakrishnan Mobile: + 91 8754449482

  •  


    Cost Saving Tips for the HPLC User


    Cost Saving Tips for the HPLC User

    HPLC analysis involves the use of expensive mobile phase solvents and recurring costs on consumables such as columns, sample and solvent filters, vials, glassware, etc.

    The costs involved in HPLC operation can be grouped in terms of laboratory throughput and operational costs. The objective of this article is to offer some useful tips to reduce costs without sacrificing the quality of results.

    Cost Saving Tips for the HPLC User
    Cost Saving Tips for the HPLC User

    Time saved means money saved

    Time-saving is the essence of high laboratory throughput which translates to saving of money. At the end of the day, timely completion of activities additionally gives you greater confidence and work satisfaction.

    • Keep required glassware ready in advance as per the planned analysis schedule.
    • Ensure availability of HPLC solvents and standards for the planned analysis.
    • Ensure leak-free connections to avoid termination of runs.
    • Adopt automated injection systems when a large number of samples are to be analyzed. Automated systems further reduce personal errors.
    • Use only calibrated and validated instruments and methods to avoid the need for repeat analysis.
    • Keep a stock of essential recommended spares to prevent time-consuming breakdowns. Users should be made aware of preventive maintenance and troubleshooting guidelines.
    • Columns required for the HPLC analysis should be kept ready in advance after required conditioning and washing cycles.

    Operational Costs

    • Mobile phase solvents are the major cost contributors in HPLC analysis. Analysis of the samples requiring the use of same mobile phase and column should be grouped together as far as possible.
    • Consumables such as sample and mobile solvent filters should be discarded after use. Do not attempt to save cost by reusing filters.
    • Vials for sample collection can be reused only after washing and drying as per prescribed procedures.
    • Lower the mobile phase flow rate to the minimum in between analysis.
    • In case HPLC columns are to be used after a long interval wash with wash solvents followed by storage solvent with end caps fixed. This will ensure that the columns will operate under required separation efficiencies and save cost on frequent column replacements
    • Check HPLC column performance in between analysis using injections of standards.
    Your suggestions and views based on your personal experiences are welcome so please leave your comments

    Important suggestions for generating reliable HPLC results


    Important suggestions for generating reliable HPLC results

    Each instrument component contributes to high reliability of results
    Each instrument component contributes to high reliability of results

    HPLC has a marked presence in analytical research and quality control laboratories. Important decisions concerning both manufacturing processes as well as publication of research findings are based on decisions which can be arrived at only if high degree of reliability can be placed on the data generated by the HPLC system.

    HPLC is a multi component system so the accuracy and reliability of results is dependent on the performance level of each component part. The present article offers some suggestions which will contribute to greater authenticity of results. For simplicity the contribution of each component part is discussed under a separate heading.

    Mobile phase

    The principal role of mobile phase is to carry the injected sample to the column and after separation in the column to transfer the individual components to the detector for their identification and quantification. Ideally a mobile phase should be prepared fresh before start of analysis and HPLC grade solvents should be used. The solvents should be free of any suspended particles. Initially filter the solvents under vacuum using 0.45 μ filter. Further use of online filters is recommended to remove any residual suspended particles. The mobile phase solvents should be fully miscible with one another and the injected sample should be miscible as well. When using buffers as mobile phase components never allow the buffer to dry out inside the system as salts formed on drying will deposit and cause hindrance to free flow of mobile phase in addition to damage to pump components.

    Sample

    Like mobile phase solvents it is a good practice to filter the sample before injection. Large volume injections will cause peak shape distortions so columns should not be overloaded by making large volume injections. Whenever a new method is to be developed it is advised to check the compatibility of the sample with the mobile phase. In case the solubility is low try a solvent or combination of solvents matching the polarity of the mobile phase mixture.

    Column

     A column is a key component of HPLC system. Its proper care and use will go a long way in providing high reliability of results.

    Operating flow rates and pressures should be changed gradually so that such changes do not disturb the stationary phase packing. Use of guard column will also prevent impurities from gaining entry to the main column. As the flow of mobile phase is dependent on temperature use of a column oven is strongly recommended so as to maintain a constant column temperature  for consistency of flow rate.

    Pump

    The pump is required to provide consistency of flow of mobile phase and maintain the solvent composition throughout the analysis run. In case of gradient analysis a pump is required to maintain the composition of mobile phase as per the software  program. Such conditions are achieved by preventing damage to pump components and timely replacement of such components on noticing any visible damage. Gradually flush the pump by allowing rinsing intermediate polarity solvents or pure water as the case may be.

    Injector/autosampler

    Consistency of injection volumes is a prime need for reproducibility of results. Manual injectors comprise of fixed volume sample loops and in case of automated modes the injection syringe maintains consistency of volume without operator intervention.

    Special care needs to be taken to prevent contamination from previous analysis. In case of manual injectors always flush the injection loop with sufficient sample and in case of automated systems make sure that intermediate wash cycles are part of the analysis program. A validation of the cleanliness of sample and standard reusable vials is vital before commencement of analysis.

    Light sources

    The majority of HPLC analysis can be carried out using UV light source. Such light sources have a useful life span. Lamp replacement as per recommendations of supplier will contribute to a high degree of reproducibility of absorbance values.

    Detectors

    A detector is the ultimate part of the HPLC system which confirms the presence of different sample components as well helps in their quantification.

    It is recommended that the detector be cleaned periodically from time to time off-line and flushed with water and mobile phase before being re- used. The operating pressure range should never be exceeded to prevent possible damage to detector cell walls.

    The suggestions offered in the article will certainly improve the quality of results but it goes without saying that there is no substitute for periodic calibration of the system against reference compounds.

    Important role of preventive maintenance in smooth functioning of HPLC systems


    Important role of preventive maintenance in smooth functioning of HPLC systems

    Important role of preventive maintenance in smooth functioning of HPLC systems
    HPLC manual injector

    Preventive maintenance plays a key role in trouble-free operation of laboratory instruments. It is even more critical for instruments that are required to operate round the clock. HPLC is one such instrument which is expected to run continuously in commercial testing laboratories and industries. In pharma and food manufacturing industries quality of products is required to be monitored at regular time intervals and there is need for the system to meet the requirements of online quality control. In case it runs into problems there will be delays in taking decisions on product quality. The same is true in laboratories involved in clinical tests or R&D activities.

    Trouble free HPLC operation can be ensured thorough regular maintenance schedules. It may not be possible to follow such schedules on daily basis but if carried out weekly or at regular time intervals they can contribute to significant increase in analysis of samples and loss of valuable time.

    The article covers some of the important areas that can be looked into even if the system is running without problems.

    Mobile Phase

    Mobile phase is the life line of your HPLC

    • Use high purity grade solvents, water and reagents for mobile phase preparation
    • Filter mobile phase under vacuum using  0.22/0.45μ size filter to remove solid suspensions, if any
    • Use online filters in mobile phase containers to make doubly sure that no solid suspended particles reach the column
    • Mobile phase should always be degassed to remove dissolved air by sonication, helium sparging or online degassing, if available
    • At time of changing mobile phases take out inlet filter from reservoir and put in fresh mobile phase .Open purge valve and purge of the earlier mobile phase completely out of flow line. Close the valve to allow mobile phase to pass to injector and flush it. Finally connect to column to wash it with the new fresh mobile phase
    • Use washing solution such as iso-propyl alcohol that is miscible with both previous and next mobile phase. Finally replace intermediate washing solution with fresh mobile phase
    • Pass HPLC grade water to wash out buffers. Use of buffers can result in crystalline deposits. The salts can damage plunger or seal and shorten the useful lifetime of the column.

    Sample Preparation

    • Check solubility of samples in mobile phase before moving to solvents of similar polarity
    • Optimize concentration for injection so as to prevent overloading of the column
    • Filter sample prior to injection using  0.22/0.45μ size filter

    Columns

    HPLC columns are expensive and if you take precautions in usage and storage you should get long service from them

    • Always avoid overloading the column. For analytical columns the sample load should not be more than 500 μg.
    • Avoid sudden changes in operating conditions such as pressure, flow rate, etc
    • Always choose guard columns for protection of columns and on changing columns change to recommended guard column
    • At end of day remember to carry out washing of columns
    • In case column is taken out of system do remember to fix the end caps
    • Before storage purge off solid salt deposits and buffers and for long time storage always store column in manufacturer recommended solvent and close the end caps
    • Use columns within the pH range 2-8 as columns begin to deteriorate faster outside this range

    Pumps

    • Operate the system within the recommended flow rates and pressure limits to prevent damage to the seals and O-rings of the pump
    • Never leave corrosive solvents or buffers in systems when pump is not running
    • Change seals and O-rings periodically as recommended by the supplier. Sonicate inlet filters regularly to prevent any suspended particles from blocking the column
    • Prime pump with mobile phase to remove remnants of earlier analysis components
    • After using buffer solutions as mobile phases run sufficient volumes of water to remove any salt deposits

    Injector

    • Flush the injector with mobile phase to remove memory effects and eliminate associated impurity peaks
    • Flush with isopropanol in between analysis
    • Keep the injector in load position only at time of sample introduction when using a manual injector
    • Rinse automated injection systems, needles with water/ isopropanol wash cycles to remove previous sample contamination

    Detector

    • The detector cell can be cleaned of residues by running water
    • Do not exceed the recommended pressure limits to avoid damage to detector cell walls

    Column Oven

    Column oven maintains constant temperature which prevents drift of retention times of the peaks. The set temperature should be maintained within limits recommended by supplier. Keep the oven clean and periodically check the connections to ensure that there is no blockage of air flow to the oven.

    A well maintained HPLC system will give trouble-free operation for continuous operation thereby avoiding breakdowns and help maintain your high sample analysis throughputs.

    Wednesday, 25 November 2020

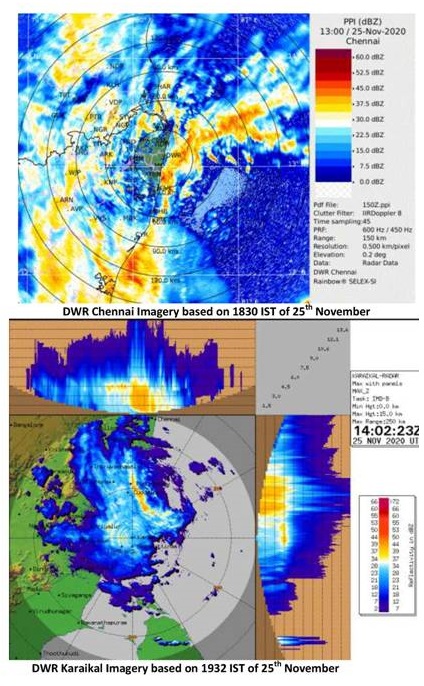
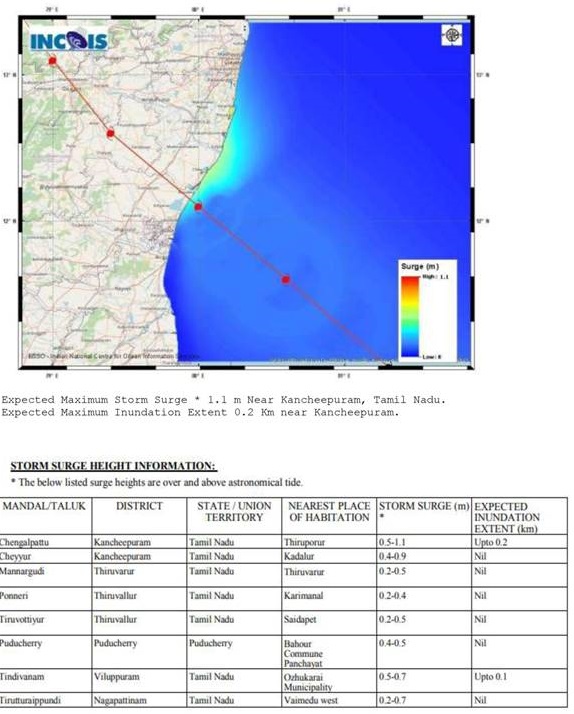
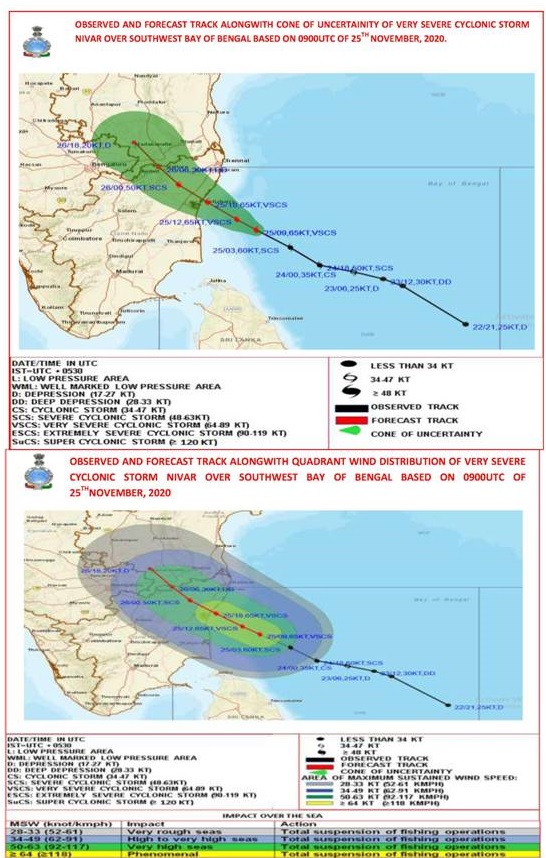
    VERY SEVERE CYCLONIC STORM “NIVAR”: Status @ 1900 Hrs


    VERY SEVERE CYCLONIC STORM “NIVAR”: Status @ 1900 Hrs

    Posted On: 25 NOV 2020 8:19PM by PIB Delhi

    According to the latest report by Cyclone Warning Division of the India Meteorology Department, Delhi:(at 1900Hrs IST)         


    DATE/TIME (IST) OF OBSERVATION

    1830 HRS IST OF 25-11-2020 / 1300 UTC OF 25.11.2020

    INTENSITY

    VERY SEVERE CYCLONIC STORM

    WIND SPEED: 120-130 KMPH GUSTING TO 145 KMPH.


    LOCATION LATITUDE/LONGITUDE

    OVER SOUTHWEST BAY OF BENGAL NEAR LAT. 11.5°N AND LONG. 80.6°E, ABOUT:

    • 95 KM EAST-SOUTHEAST OF CUDDALORE.
    • 100 KM EAST-SOUTHEAST OF PUDUCHERRY.
    • 170 KM SOUTH-SOUTHEAST OF CHENNAI.

    PAST MOVEMENT

    CENTRE MOVED WEST-NORTHWESTWARDS WITH A SPEED OF 13 KMPH DURING PAST 06 HOURS.


    OBSERVATIONS FROM THE COAST

    WIND-SPEED (KMPH):

    NAGAPATNAM-36,               KARAIKAL-25,              CUDDALORE-18, PUDUCHERRY-18 AND CHENNAI-18 KMPH.

    RAINFALL (MM) DURING 08:30 TO 1830 HOURS IST OF 25TH NOVEMBER 2020:

    NAGAPATNAM-47,               KARAIKAL-64,              CUDDALORE-86,

    PUDUCHERRY-69 AND CHENNAI-62

    FORECAST MOVEMENT, INTENSITY AND LANDFALL

    TO MOVE NORTHWESTWARDS AND CROSS TAMIL NADU AND PUDUCHERRY COASTS BETWEEN KARAIKAL AND MAMALLAPURAM AROUND PUDUCHERRY DURING MID-NIGHT OF 25TH AND EARLY HOURS OF 26TH NOVEMBER 2020 WITH WIND SPEED OF 120-130 KMPH GUSTING TO 145 KMPH.


    Monthly Production Report for October,2020--Ministry of Petroleum & Natural Gas


    Ministry of Petroleum & Natural Gas

    Monthly Production Report for October,2020

    Posted On: 25 NOV 2020 3:51PM by PIB Delhi
    1. Production of Crude Oil


    Crude oil production[1] during October,2020 was2567.70 TMT which is7.10% lower than target and6.24% lower when compared with October2019.Cumulative crude oil production during April-October, 2020 was 17940.49 TMT which is 5.0% and 6.12% lower than target for the period and production during corresponding period of last year respectively.Unit-wise and State-wise crude oil production is given at Annexure-I. Unit-wise crude oil production for the month of October, 2020 and cumulatively for the period April-October, 2020 vis-à-vis same period of last year has been shown in Table-1 and month-wise in Figure-1.

    Table-1: Crude Oil Production (in TMT)

    Oil Company

    Target

    October (Month)

    April-October (Cumulative)

    2020-21 (Apr-Mar)

    2020-21

    2019-20

    % over last year

    2020-21

    2019-20

    % over last year

    Target

    Prod.*

    Prod.

    Target

    Prod.*

    Prod.

    ONGC

    20931.54

    1784.43

    1707.03

    1712.95

    99.65

    12283.81

    11860.92

    11965.08

    99.13

    OIL

    3268.00

    279.92

    256.73

    272.57

    94.19

    1841.94

    1742.14

    1886.83

    92.33

    PSC Fields

    8265.00

    699.45

    603.95

    752.94

    80.21

    4759.52

    4337.42

    5258.52

    82.48

    Total

    32464.53

    2763.80

    2567.70

    2738.46

    93.76

    18885.27

    17940.49

    19110.43

    93.88

    Note: 1. Target for the year 2020-21 is provisional, subject to finalization.     *: Provisional

                    2. Totals may not tally due to rounding off.


    Figure-1: Monthly Crude Oil Production


    Unit-wise production details with reasons for shortfall are as under:

      1. Crude oil production by ONGC in nomination block during October, 2020 was 1707.03 TMT which is 4.34%lower than target and0.35%lower when compared with October 2019. Cumulative crude oil production by ONGC during April-October, 2020 was 11860.92 TMT which is 3.44%and 0.87% lower than target for the period andproduction during corresponding period of last year respectively. Reasons for shortfall in production are as under:


    1. Production planned from WO16 cluster could not be realized due to delay in MOPU (Sagar Samrat) as activities at GPC yard Abu Dhabi got affected due to Covid restrictions/lockdown
    2. Production planned from new wells in Ratna field affected due to non- availability of Electrical Submersible Pumps  for well completion due to  implications of COVID-19
    3. New wells planned under Cluster 8 development project delayed due to toppling of D-30-2 platform jacket during installation and further delay in installation of new platforms due to COVID implications.


      1. Crude oil production by OIL in the nominationblock during October, 2020 was256.73 TMT which is 8.28% lower than the monthly target and 5.81% lower than the October, 2019. Cumulative crude oil production by OIL during April-October, 2020 was 1742.14 TMT which is 5.42% and 7.67% lower than target for the period and production during corresponding period of last year respectively. Reasons for shortfall in production are as under:


    1. Less than planned contribution from workover wells, drilling wells and old wells.
    2. Rise in water cut and decline in liquid production from existing wells.
    3. Bandhs /blockade by local people and associations etc. after the Baghjan Blowout, protests/agitation etc.


      1. Crude oil production by Pvt/JVscompanies in the PSC (production sharing contract) regime during October,2020 was 603.95 TMT which islower by 13.65% than the monthly target and 19.79%lowerthanOctober, 2019.Cumulative crude oil production by Pvt/JVs companies during April-October, 2020 was 4337.42 TMT which is 8.87% and 17.52% lower than target for the period and production during corresponding period of last year respectively.Reasons for shortfall in production are as under:


    1. RJ-ON-90/1(CEIL): (1) Mangala: - Major elements brought online in the last week of October, Slug catcher and sections of productions lines are to be hooked up. (2) Bhagyam: Artificial lift malfunction.  Delayed polymer injection. Addl. Downtime-Over Head Line/Grid failures. (3) Aishwarya: Delayed polymer injection. Additional downtime due to Electrical Submersible Pump failures in few wells. (4) ABH: Delay in hook-up of ABH Stage-2 wells. (5) Satellite Fields: Failure or flow cease in few wells. (6) Tukaram & Kaam-1: Well and Surface Facility construction schedule impacted by COVID-19.
    2. RAVVA (CEIL): Ullage problem due to Production reduced causing kink in Hose pipe in Aug-2020. Production reduced by 50% for few days in October 2020. Rectification job ongoing.
    3. CB-ONN-2003/1 (ONGC): Deviation due to non-acceptance of crude by Off the Shelf (OTS) Ravva (ullage problem).
    4. CB-ONN-2000/1 (GSPC): Well PK#2 became non-producing in Dec-2019 due to possible casing damage and reservoir issues.  Well SE_DEV#1, SE#1A and SE1#A1 is shut-in due to unavailability of effective demulsifier to break tight water and oil emulsion.
    5. CY-ONN-2002/2 (ONGC): Well MDDD couldn't be drilled and completed because of local agitation.


    1. Production of Natural Gas


    Natural gas production during October,2020 was 2418.88MMSCM which is 18.20% lower than the monthly target and 8.41% lower when compared with October, 2019. Cumulative natural gas production during April-October, 2020 was 16372.77MMSCM which is 13.90% and 12.19% lower than target for the period and production during corresponding period of last year respectively. Unit-wise and state-wise natural gas production is given at Annexure-II. Unit-wise natural gas production for the month of October, 2020 and cumulatively for the period April-October, 2020 vis-à-vis same period of last year has been shown in Table-2 and month-wise in Figure-2.

    Table-2: Natural Gas Production (inMMSCM)

    Oil Company

    Target

    October (Month)

    April-October (Cumulative)

    2020-21 (Apr-Mar)

    2020-21

    2019-20

    % over last year

    2020-21

    2019-20

    % over last year

    Target

    Prod.*

    Prod.

    Target

    Prod.*

    Prod.

    ONGC

    24437.08

    2061.06

    1883.75

    1954.35

    96.39

    14293.51

    12863.07

    14026.06

    91.71

    OIL

    3181.54

    289.74

    222.48

    239.23

    93.00

    1850.13

    1464.28

    1623.61

    90.19

    PSC Fields

    6826.82

    606.20

    312.64

    447.46

    69.87

    2871.99

    2045.42

    2996.49

    68.26

    Total

    34445.44

    2957.00

    2418.88

    2641.04

    91.59

    19015.63

    16372.77

    18646.15

    87.81

    Note: 1. Target for the year 2020-21 is provisional, subject to finalization.     *: Provisional

                    2. Totals may not tally due to rounding off.


    Figure-2: Monthly Natural Gas Production


      1. Natural gas production by ONGC in the nominationblocks during October, 2020 was 1883.75MMSCM which is 8.60% lower than target and 3.61% lower when compared with October 2019. Cumulative natural gas production by ONGC duringApril-October, 2020 was 12863.07 MMSCM which is 10.01% and 8.29% lower than target for the period and production during corresponding period of last year respectively.Reasons for shortfall in production are as under:


    1. Closure of Gas wells in western offshore due to Hazira Plant shutdown on 24.09.20 and subsequent normalization.
    2. Less Gas production from WO16 cluster due to delay in MOPU and non-realization of gain planned from new subsea wells in Bassein field due to delay in subsea umbilical connections/hook up jobs in view of Covid-19 implications.
    3. Less than planned production from Vasistha/S1 wells in EOA due certain reservoir related issues.


      1. Natural gas production by OILin the nomination block during October, 2020 was 222.48 MMSCM which is 23.21% lower than monthly target and 7.0% lower than October, 2019. Cumulative natural gas production by OIL during April-October, 2020 was 1464.28 MMSCM which is 20.85% and 9.81% lower than target for the period and production during corresponding period of last year respectively. Reasons for shortfall in production are as under:


    1. Low upliftment/demand of gas by the major customers.
    2. Bandhs /blockade by local people and associations etc. after the Baghjan Blowout, protests/agitation etc.


      1. Natural gas production by Pvt/JVs companiesin the PSC (production sharing contracts) regime during October,2020 was 312.64MMSCM which is 48.43% lowerthan monthly target and30.13% lower than October, 2019. Cumulative natural gas production by Pvt/JVs during April-October, 2020 was 2045.42MMSCM which is 28.78% and 31.74% lower than target for the period and production during corresponding period of last year respectively. Reasons for shortfall in production are as under:


    1. KG-DWN-98/3 (RIL): D-34 production commencement delayed due to COVID 19 pandemic. Production expected to commence in Nov End ’2020.
    2. RJ-ON/6 (FEL): Power Plant customer has further reduced gas off take as one of the Gas turbine is on emergency shutdown.
    3. RJ-ON-90/1 (CEIL): RDG - Delay in new Raageshwari Deep Gas (RDG) start up due to Covid-19.
    4. KG-DWN-98/2 (ONGC): Less Gas production from well due to reduction of choke. (ONGC)
    5. Raniganj East (ESSAR): Production curtailed due to limited sales off-take.


    1. Crude Oil Processed (Crude Throughput)


    Crude Oil Processed during October, 2020 was 18389.27TMT which is 15.26% lower than the target for the month and16.13% lowerwhen compared with October, 2019. Cumulative crude throughput during April-October, 2020 was118555.33 TMT which is 18.41% and 19.71% lower than target for the period and crude throughput during corresponding period of last year respectively.Refinery-wise details of the crude throughput and capacity utilization during the month of October, 2020 vis-à-vis October, 2019 are given at Annexures-III and Annexures -IV. Company-wise crude throughput for the month of October, 2020 and cumulatively for the period April-October, 2020vis-à-vis same period of last year has been shown in Table-3 and month-wise in Figure-3.


    Table 3: Crude Oil Processed(Crude Throughput) (in TMT)

    Oil Company

    Target

    October (Month)

    April-October (Cumulative)

    2020-21 (Apr-Mar)

    2020-21

    2019-20

    % over last year

    2020-21

    2019-20

    % over last year

    Target

    Prod.*

    Prod.

    Target

    Prod.*

    Prod.

    CPSE

    148031.12

    12782.65

    10763.45

    12473.31

    86.29

    84186.56

    65396.27

    83657.71

    78.17

    IOCL

    72499.86

    6565.53

    5662.06

    6042.68

    93.70

    41651.68

    32561.32

    40862.90

    79.68

    BPCL

    30499.95

    2733.57

    2116.95

    2679.46

    79.01

    17888.79

    12781.12

    17884.98

    71.46

    HPCL

    17867.47

    918.94

    1288.84

    1388.35

    92.83

    10107.83

    9321.98

    9872.82

    94.42

    CPCL

    9000.00

    930.00

    725.26

    711.09

    101.99

    4470.00

    4108.58

    5899.85

    69.64

    NRL

    2700.00

    229.00

    232.23

    246.41

    94.24

    1582.00

    1500.61

    1640.77

    91.46

    MRPL

    15400.00

    1400.00

    731.02

    1397.96

    52.29

    8450.00

    5077.96

    7445.37

    68.20

    ONGC

    63.83

    5.61

    7.10

    7.37

    96.36

    36.27

    44.70

    51.02

    87.62

    JVs

    14772.00

    1236.00

    1599.32

    1771.04

    90.30

    8535.00

    9239.89

    11411.12

    80.97

    BORL

    7800.00

    660.00

    561.14

    666.67

    84.17

    4560.00

    3072.32

    4445.74

    69.11

    HMEL

    6972.00

    576.00

    1038.18

    1104.36

    94.01

    3975.00

    6167.58

    6965.39

    88.55

    Private

    89515.16

    7681.81

    6026.50

    7681.81

    78.45

    52585.59

    43919.17

    52585.59

    83.52

    RIL

    68894.99

    5897.66

    5463.71

    5897.66

    92.64

    40400.68

    34440.56

    40400.67

    85.25

    NEL

    20620.18

    1784.16

    562.79

    1784.16

    31.54

    12184.92

    9478.61

    12184.92

    77.79

    TOTAL

    252318.28

    21700.46

    18389.27

    21926.16

    83.87

    145307.16

    118555.33

    147654.43

    80.29

    Note: 1. Target for the year 2020-21 is provisional, subject to finalization.     *: Provisional

                    2. Totals may not tally due to rounding off.


    Figure 3: Crude Oil Processed (Crude Throughput)


    3.1       CPSE Refineries’ crude oil processed during October, 2020 was 10763.45TMT which is 15.80% lower than the target for the month and13.71%lowerwhen compared with October, 2019.Cumulative crude throughputby CPSE refineries during April-October, 2020 was 65396.27TMT which is 22.32% and 21.83% lower than target for the period and crude throughputduring corresponding period of last year respectively.Reasons for shortfall in production are as under:


    1. IOCL-Barauni, Koyali, Haldia, Mathura, Panipat and Paradip: Crude processed regulated for low product demand due to COVID impact.
    2. HPCL-Mumbai: Crude processed lower due to major power disturbance in Mumbai resulting in shutdown of primary and secondary units.
    3. HPCL-Visakh: Crude processed lower due to unplanned shutdown of secondary unit.
    4. CPCL-Manali &MRPL-Mangalore: Crude processed lower due to Lower demand due to impact of COVID-19 lockdown.


    3.2       JV refineries’ crude oil processed during October, 2020 was 1599.32TMT which is 29.39% higher than the target for the month but 9.70% lower when compared with October, 2019. Cumulative crude throughput during April-October, 2020 was9239.89 TMT which is 8.26% higher than target for the period but19.03% lower when compare with the corresponding period of last year respectively.

    3.3       Private refineries’ crude oil processed during October, 2020 was 6026.50TMT which is 21.55% lower than the corresponding month of last year. Cumulative crude throughputduring April-October, 2020 was 43919.17 TMT which is 16.48% lower than thecorresponding period of last year.


    1. Production of Petroleum Products


    Production of Petroleum Products during October, 2020 was 18876.54 TMT which is 15.44% lower than the target for the month and 16.97% lower when compared with October, 2019. Cumulative production during April-October, 2020 was 126165.06 TMT which is 14.97% and 16.37% lower than target for the period and production during corresponding period of last year respectively. Unit-wise production of petroleum products is given at Annexure-V. Company-wise production for the month of October, 2020 and cumulatively for the period April-October, 2020 vis-à-Vis same period of last year has been shown in Table-4 and month-wise in Figure-4.


      1. Production of petroleum Products by Oil’s Refineries during October, 2020 was 18513.65 TMT which is 15.59% lower than the target for the month and 17.07% lower when compared with October, 2019. Cumulative production of petroleum products by refineries during April-October, 2020 was 123714.97 TMT which is 15.07% and 16.45% lower than target for the period and production during corresponding period of last year respectively.


      1. Production of petroleum Products by Fractionators during October, 2020 was 362.89 TMT which is 6.81% lower than the target for the month and 11.45% lower when compared with October, 2019. Cumulative production by Fractionators during April-October, 2020 was 2450.09 TMT which is 9.64% and 11.90% lower than target for the period and production during corresponding period of last year respectively.


    Table 4: Production of Petroleum Products (TMT)

    Oil Company

    Target

    October (Month)

    April-October (Cumulative)

    2020-21 (Apr-Mar)

    2020-21

    2019-20

    % over last year

    2020-21

    2019-20

    % over last year

    Target

    Prod.*

    Prod.

    Target

    Prod.*

    Prod.

    CPSE

    139203.86

    12030.97

    10348.46

    11886.45

    87.06

    79205.03

    61986.54

    78809.19

    78.65

    IOCL

    68912.87

    6255.07

    5576.39

    5815.09

    95.90

    39587.80

    31265.23

    38830.53

    80.52

    BPCL

    28965.13

    2583.27

    2027.50

    2651.43

    76.47

    17000.52

    12277.93

    16913.79

    72.59

    HPCL

    16438.97

    840.28

    1127.25

    1325.34

    85.05

    9302.60

    8666.78

    9187.12

    94.34

    CPCL

    8278.87

    862.88

    701.65

    635.35

    110.44

    4075.99

    3756.69

    5423.16

    69.27

    NRL

    2660.91

    226.00

    258.82

    238.76

    108.40

    1560.10

    1518.65

    1586.94

    95.70

    MRPL

    13887.11

    1258.21

    650.01

    1213.79

    53.55

    7643.93

    4458.39

    6820.12

    65.37

    ONGC

    60.00

    5.27

    6.84

    6.70

    102.14

    34.09

    42.86

    47.55

    90.15

    JVs

    13590.40

    1136.48

    1513.02

    1671.06

    90.54

    7850.68

    8612.19

    10662.68

    80.77

    BORL

    6958.40

    588.48

    510.95

    600.20

    85.13

    4068.68

    2659.77

    4063.39

    65.46

    HMEL

    6632.00

    548.00

    1002.07

    1070.86

    93.58

    3782.00

    5952.42

    6599.30

    90.20

    Private

    102154.50

    8766.05

    6652.17

    8766.05

    75.89

    58603.85

    53116.24

    58603.85

    90.64

    RIL

    82374.12

    7029.68

    6181.87

    7029.68

    87.94

    46916.11

    44025.96

    46916.11

    93.84

    NEL

    19780.38

    1736.37

    470.31

    1736.37

    27.09

    11687.74

    9090.28

    11687.74

    77.78

    Total Refinery

    254948.76

    21933.50

    18513.65

    22323.55

    82.93

    145659.56

    123714.97

    148075.72

    83.55

    Fractionators

    4572.73

    389.42

    362.89

    409.80

    88.55

    2711.48

    2450.09

    2781.03

    88.10

    TOTAL

    259521.49

    22322.91

    18876.54

    22733.35

    83.03

    148371.04

    126165.06

    150856.75

    83.63

    Note: 1. Target for the year 2020-21 is provisional, subject to finalization.     *: Provisional

                    2. Totals may not tally due to rounding off.


    Figure 4: Monthly Refinery Production of Petorleum Products


    Click here to see Annexure-I

    Click here to see Annexure-II

    Click here to see Annexure-III

    Click here to see Annexure-IV

    Click here to see Annexure-V

    *****

    YB/SK


    (Release ID: 1675620) Visitor Counter : 68


    Read this release in: Tamil