Ministry of Environment, Forest and Climate Change
Ministry of Environment, Forest and Climate Change Rebuts the Environmental Performance index 2022 released recently “Index has many indicators based on unfounded assumptions”
“Some of these indicators used for assessing performance are extrapolated and based on surmises and unscientific methods”
Posted On: 08 JUN 2022 1:39PM by PIB Delhi
The Environmental Performance index 2022 released recently has many indicators based on unfounded assumptions. Some of these indicators used for assessing performance are extrapolated and based on surmises and unscientific methods.
The Ministry of Environment does not accept its analysis and conclusions for the following reasons: -
A new indicator in the Climate Policy objective isProjected GHG Emissions levels in 2050. This is computed based on average rate of change in emission of the last 10 years instead of modelling that takes into account a longer time period, extent of renewable energy capacity and use, additional carbon sinks, energy efficiency etc. of respective countries.
Both forests and wetlands of the country are crucial carbon sinks which have not been factored in while computing the projected GHG emissions trajectory upto 2050 given by EPI 2022.
Historical data on the lowest emission trajectory has been ignored in the above computation.
The weight of indictors in which the country was performing well has been reduced and reasons for change in assignment of weights has not been explained in the report.
The principle of equity is given very low weightage in the form of the indicators like GHG emission per capita and GHG Emission intensity trend. The CBDR-RC principle is also barely reflected in the composition of the index.
India has already achieved the target of 40% of installed electricity capacity from non- fossil fuel based sources.
The Copernicus air pollutant concentration data based on which DALYs are derived have higher uncertainty in regions with less extensive monitoring networks and emissions inventories. This limitation reduces the chance of accurate assessment of Air Quality.
The indicators on Water quality, Water use efficiency, Waste Generation per capita which are closely linked to Sustainable Consumption and Production are not included in the Index.
The Index emphasizes the extent of Protected Areas rather than the quality of protection that they afford. Management Effectiveness Evaluation of Protected areas and eco-sensitive regions is not factored into the computation of Biodiversity Indices.
Again the index computes extent of ecosystems but not their condition or productivity. Efforts must be made to include metrics that truly capture ecosystem productivity such that regulatory, provisioning as well as cultural services provided by various ecosystems like forests, wetlands, croplands are assessed and reflected in performance.
Indicators like Agro biodiversity, soil health, food loss and waste are not included even though they are important for developing countries with large agrarian populations.
The detailed analysis of the flaws is given below:
Climate Change Issue Category:
Climate Policy is introduced as a new policy objective in 2022. Earlier it was part of the Ecosystem Vitality Objective as Climate Change issue category with a weight of 24%- in the last index . The weight of the policy objective is 38%. India is assigned a rank of 165 in this objective vis a vis is 106 earlier. This is because a few new parameters have been added in the policy objectives and weights have been modified.
For a newly added Indicator “Projected Emissions levels in 2050” which is 36% of the issue category Climate Change, the methodology used is- “The average rate of increase or decrease in emissions over ten years (2010–2019) is calculated and then the trend is extrapolated to 2050, projecting the level of emissions in that same year”. India being a developing country and second largest in population will have the increasing trend of GHG emissions. The correct method would be to calculate GHG emissions per capita and have a model with the coefficients taking into account the effect of policies to reduce emissions like increase in use of renewable energy, electric vehicles, creation of carbon sink etc.to project the values for future years. An example of CCPI 2022 indicator may be referred to where the indicators on GHG emission per capita have been considered and India has a high score of 31.42 with the highest score in the index being as 33.93.
Fig 1 of the EPI 2022 Report based on Global Carbon Budget 2021 shows that India has one of the lowest emission trajectories vis a vis Other Countries as well as the Rest of the World. Hence, without factoring this aspect, the use of biased metrics and biased weights has resulted in a low rank. This also shows that the indicator based on data for only the past 10 years, does not take into account the historical responsibility of the developed countries.
The weight of the indicators in which India has scored well is reduced from the previous assessment in 2020. For example, for Black Carbon growth rate indicator the score of India has improved to 100 in 2022 from 32 in 2020, whereas the overall weight of the indicator is reduced to 0.0038 in 2022 from 0.018 in 2020. Further, there is no specific rationale that has been adopted for selection of weights. It seems that the selection of weights is entirely based on Publishing agency’s choice which is not suitable for a global index.
The Report admits that “Industrializing countries have a right to sustainably develop, expand their economies, and improve their populations’ quality of life. This may require initial increases in greenhouse gas emissions from least-developed countries, although these nations may seize the opportunity to technologically leap-frog and preferentially adopt renewable energy sources over fossil fuel based infrastructure.” However, this factor is incorporated only marginally by bringing in the indicators of GHG Intensity Trend and GHG per capita in which the country’s ranks have actually improved but very low weights are assigned to such Indicators.
The Climate change indicators do not sufficiently incorporate the UNFCCC equity principle on Common but differentiated responsibilities as per national circumstances and usage of renewable energy while formulating performance indicators in the Climate Change issue category and hence a ‘Developing Country” perspective is lacking. The limitation was communicated to the Publishing Agency and it was stated by the representative of Publishing agency that the engagement with India and other developing countries would be done so that this skew in the issue category is rectified. However, no such efforts have been observed.
The 2022 EPI’s adjusted emissions growth rate indicators are derived from existing GHG inventories that in turn are calculated using several assumptions.
No indicator talks about the renewable energy, energy efficiency and process optimization. The selection of indicators is biased and incomplete.
Per capita GHG emissions contribute only a miniscule 2.6% weight overall in the Index.
India is party to Paris Agreement and has given a goal of NET ZERO by 2070 and hence comparing it to countries with Projected 2050 emissions level in 2050 equal to or below zero receiving the maximum score is against the principle of Equity as enshrined in CBDR-RC.
By its own admissions, “The indicator is based on several important assumptions. First, the pilot indicator does not yet account for carbon dioxide removal. Current projections only account for decreasing emissions. Although the low rate of carbon dioxide removal from the atmosphere currently permits this assumption, the EPI team recognizes that carbon capture and sequestration efforts will become an increasingly important feature of national climate policy portfolios in the years to come. Promising strategies for carbon drawdown include both nature-based solutions and engineered technologies (NASEM, 2019; Royal Society, 2017). As research and datasets on carbon sequestration advance, subsequent iterations of the EPI’s projected emissions indicator will incorporate negative emissions estimates into 2050 projections (Harris et al., 2021).
Thus improvement in Tree Cover Loss and wetland loss categories for India is not linked to the projected emissions trajectory contrary to the NDC (nationally determined contribution) of Additional Carbon sink given by the country. Both forests and wetlands are crucial carbon sinks which are not reflected in the projected emissions.
The emissions are estimated by multiplying activity by a corresponding emissions factors. By its own admission the report states “These emissions factors do not account for variation across sites, factories, and operations. For instance, agricultural emissions factors vary in ways too granular to be comprehensively represented in current national emissions inventories (Walling and Vaneeckhaute, 2020). Uncertainties are higher for non CO2 greenhouse gases. Quantifying emissions from certain sectors, such as agriculture, can be difficult, meaning estimates are derived from regional data that can introduce uncertainties.” India is predominantly a developing country. IN many cases , GHG emission inventories use default emission factors not specific to the country as refinement of inventory computation is a gradual and resource intensive process.
II. For Environmental Health indicators-
The Copernicus air pollutant concentration data have higher uncertainty in regions with less extensive monitoring networks and emissions inventories. This limitation reduces the chance of capturing the accurate data. With lack of accurate data, the value of the indicator is becomes doubtful and the score bases on the same may not be valid.
The index fails to have an indicator that can measure actual water quality based on criteria for healthy water. India has standards for water quality and monitoring stations as well. India also submits the data on Good ambient water quality for Sustainable Development Goals. This is far more important than DALYs as it measures ambient water quality for all life forms.
III. The Ecosystem Vitality Policy Objective’s weightage has reduced from 60% to 42% in the total EPI.
Biodiversity & Habitat:
EPI in its 2022 Report acknowledges that the indicators - Terrestrial Biome Protection, National (TBN) and Global (TBG) are incomplete proxies for realized biome protection as they are unable to evaluate the management effectiveness. Further, these indicators rely on the international classification of biomes to assess the percentage of biomes that are protected. Since the nationally/legally defined protected areas may not always be aligned with the geographical boundaries of respective biomes, it may not be prudent to rely fully on the international classification and hence, efforts must be taken to develop other proxies which capture the conservation efforts of the country whether within or beyond specific biomes.
Indicators such as TBN, TBG or the Protected Area Representativeness Index (PARI) rely on aerial coverage of protected areas however, that does not guarantee that all species are prioritized or even considered by area management plans, or that protections are effective and enforced. Even with extensive field verification, the full suitable habitat ranges of many species remain unknown.
Further, reliance on remote sensing data for estimating the threats to species from habitat loss as reported by indicators like Species Habitat Index (SHI), Species Protection Index (SPI) and the Biodiversity Habitat Index (BHI) often lead to challenges in collecting ecological data, especially at the species level. As per the EPI 2022 Report, indicators are also affected/limited by the spatial resolution of the underlying datasets. The aforementioned aspects indicate that even data intensive parameters might not be suitable or effective in capturing the performance of a country towards biodiversity and habitat protection.
For the Marine Protected Areas indicator, it may be noted the entire EEZ is taken as the denominator for computing this metric, which is not suitable for India as it has all its coastal and MPAs within the Territorial Sea and taking a vast area of EEZ as the denominator is not acceptable.
During the meeting with Yale University in March 2022, it was mentioned that the Publishing Agency will help establish contact with MoL, GBIF and CSIRO in order to help India understand/replicate the methodology and suggest reforms that would be more suitable in the Indian context. However, no such support has been extended.
Also, since the process of data submission on the World Database for Protected Areas is underway for updating data on the Recorded Forest Areas (RFA) of India, the Publishing Agency was requested to refer to the Indian State of Forest Report (ISFR 2021) as part of the biodiversity variable, but the same has not been taken into account. Thus an indicator framed using the outdated data does not reflect the correct picture.
Lastly, as reported in the JRC 2020 Report, strongly co-related indicators like the Terrestrial Biome Protection - National (TBN) and Terrestrial Biome Protection – Global (TBG) should not be included as they report the same phenomenon and are hence redundant. Notwithstanding, both indicators have been included in the 2022 Report which together account for nearly 45% of the Biodiversity & Habitat issue category.
Further, as pointed in the JRC 2020 Report, the indicators which have no significant correlation with the respective issue category or with the EPI per se, have also been retained such as the Biodiversity Habitat Index (BHV) and the Species Habitat Index (SHI) that could have been replaced with more appropriate indicators.
Ecosystem Services:
As the name of the issue category is ecosystem services, efforts must be made to include metrics that truly capture regulatory, provisioning as well as cultural services provided by various ecosystems like forests, wetlands, croplands etc. During the meeting with the Publishing Agency, this point was raised and it was informed ecosystem productivity and ecosystem services do not seem to be reflected in the biodiversity indicators and hence loss of biodiversity does not seem to be captured holistically. This point hence covers both issue categories.
The JRC 2020 Report has suggested that a higher weightage must be given to Grassland loss and Wetland loss which has been incorporated in EPI 2022 i.e. from 5% each to 12.5% each, however, the improvement under these parameters which is essentially towards creating additional carbon sink is not reflected in the Climate change issue category. This point therefore covers two Policy objectives i.e. Ecosystem Vitality as well as Climate Policy.
Agriculture:
India being an agrarian country has taken major steps towards the improvement of its agriculture sector and its practices such as Agro biodiversity, water use efficiency and soil health. With only two indicators under the Agriculture category the efforts of India towards the improvement of its agriculture sector and its practices are not reflected. Further in consonance with SDG 12, food waste and loss should be given due importance for agrarian economies to take care of vulnerability aspects which is also missing in the index.
Fisheries:
The JRC report of 2020 states that the Fish Stock Status (FSS) and Fish caught by Trawling (FGT) are negatively correlated with the policy objective of Ecosystem Vitality as well as the EPI per se, though they are positively correlated with their issue category. Thus, refinement of the indicators was suggested, however, no major change in the parameters or their weights has been observed.
We are thankful to SHRI GVS ANAND SIR AND SHRI V . S. SUNDER SIR AND Dr. KVS MURTY SIR GIVEN OPPORTUNITIES TO Associates to attend world environment programme.
World Environment Day (WED) is celebrated on 5 June every year, and is the United Nations' principal vehicle for encouraging awareness and action for the protection of our environment. First held in 1974, it has been a flagship campaign for raising awareness on emerging from environmental issues to marine pollution, human overpopulation, and global warming, to sustainable consumption and wildlife crime. World Environment Day has grown to become a global platform for public outreach, with participation from over 143 countries annually. Each year, WED has a new theme that major corporations, NGOs, communities, governments and all celebrities worldwide adopt to advocate environmental causes.
Q: Why is World Environment Day celebrated June 5th?
World Environment Day is held each year on June 5. It is one of the principal vehicles through which the United Nations (UN) stimulates worldwide awareness of the environment and enhances political attention and action.
Q: When was the first World Environment Day celebrated?
World Environment Day [WED] was established by the UN General Assembly in 1972 on the first day of the Stockholm Conference on the Human Environment, resulting from discussions on the integration of human interactions and the environment..
Q: Who founded Environment Day?
World Environment Day [WED] was established by the UN General Assembly in 1972 on the first day of the Stockholm Conference on the Human Environment, resulting from discussions on the integration of human interactions and the environment.
Who started environment day?
On the first day of the Stockholm Conference on Human environment in 1972, The World Environment Day was established by the United Nations.
Since its beginning in 1972, World Environment Day has developed into a global platform for raising awareness as well as taking action on urgent issues from marine pollution and global warming to sustainable development and wildlife crime. Millions of people have taken part over the years, helping drive change in our consumption habits of natural resources alongwith national and international environmental policy.
Theme:
World Environment Day is the biggest international day for the environment, led by the United Nations Environment Programme (UNEP), and held annually since 1974. It has grown to be the largest global platform for environment outreach. It is celebrated by millions of people across the world. This year, World Environment Day 2022 is hosted by Sweden. “Only One Earth” is the campaign slogan, with the focus on “Living Sustainably in Harmony with Nature”. KIIT DU celebrating this day by organising an INTERNATIONAL CONFERENCE ON “LIVING SUSTAINABILITY IN HARMONY WITH NATURE”, during June 4th – 5th, 2022.
What can I do for world environment day?
Spread awareness- It is very important for everyone to be aware of things happening to our environment, especially when the reason behind this catastrophe is us! Spread awareness through billboards, door-to-door campaign, pamphlets, completions, power point presentation, short skits and many more.
Start from home - charity begins from home, this is self explanatory. We need to start bringing changes from within ourselves by realising
Ministry of Environment, Forest and Climate Change
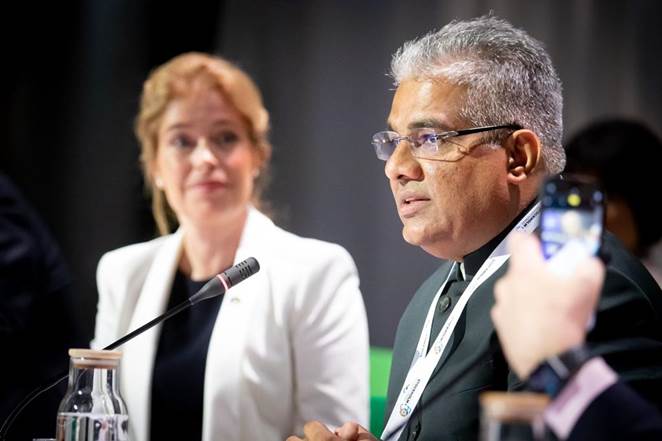
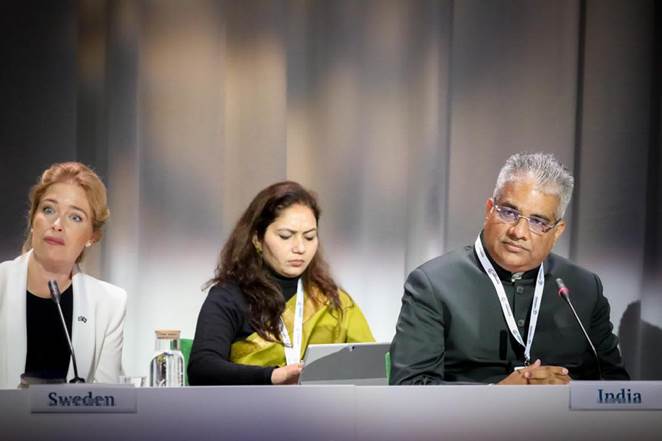
India and Sweden Host Industry Transition Dialogue in Stockholm “The developing world needs not just an industrial ‘transition’, but an industrial renaissance – a flowering of industries that will create jobs and prosperity along with a clean environment”: Shri Bhupender Yadav
“Developed nations, with their historical experiences, must take lead in the global transition towards net-zero & low carbon industry”: Shri Bhupender Yadav
Posted On: 01 JUN 2022 5:42PM by PIB Delhi
India and Sweden hosted the Industry Transition Dialogue today in Stockholm, as a part of their joint initiative i.e. Leadership for Industry Transition (LeadIT). The LeadIT initiative lays specific focus on hard to abate sectors that are key stakeholders in the global climate action and require specific interventions.
This high level of dialogue has contributed to the UN Conference ‘Stockholm+50’: a healthy planet for the prosperity of all –our responsibility, our opportunity’, takingplace on 2 and 3 June 2022 and set the agenda for COP27.
The event was opened by address from Union Minister of Environment, Forest and Climate Change, India, Shri Bhupender Yadav and Minister for Climate and the Environment, Sweden, Ms. Annika Strandhäll.
In the opening address the Union Minister congratulated the world for the upcoming 50th anniversary of United Nations Conference on the Human Environment that took place in 1972 and put environmental issues at the forefront of the international concerns. He emphasized that it is the time to celebrate 50 years of collaborative action, at the same time to introspect on what has been achieved and what more is yet to be done. “The developing world needs not just an industrial ‘transition’, but an industrial renaissance – a flowering of industries that will create jobs and prosperity along with a clean environment. The developed nations, with their historical experiences, must take lead in the global transition towards net-zero & low carbon industry.”, the minister stated.
Japan and South Africa, the latest members of the initiative were welcomed. This extends the total membership of LeadIT to 37 including countries and companies together. The minister also updated the audience about the progress made under the initiative that includes the sectoral road mapping, workshops and industrial field visits to facilitate knowledge sharing and combined efforts.
During the event, India chaired the roundtable dialogues on Priorities for implementation 2022-23. The need for speed and scale in climate action was echoed by all the speakers. The countries and companies shared their initiatives, success stories and plans for future. Some very specific and valuable insights were shared by the participants. It was felt that the domestic actions if implemented and communicated well can be valuable inspiration at the international level. The efforts and exchanges through such platforms have the potential to lead the world in right direction. The commitments and pledges now must translate into action in mitigation and adaptation that rides on climate finance and technology transfer.