What Is PERT in Project Management?
In the vast world of project management, there are several methods and strategies that can help in the planning, scheduling, and coordination of tasks and resources. One of these tools is a PERT chart.
In this article, we will discuss what PERT charts in project management are and how they were developed.
Before we get started, if you would like to streamline all your projects right now and boost your productivity with powerful project management features such as Gantt charts and Kanban boards, you can unlock a free trial with Wrike today.
The definition of PERT
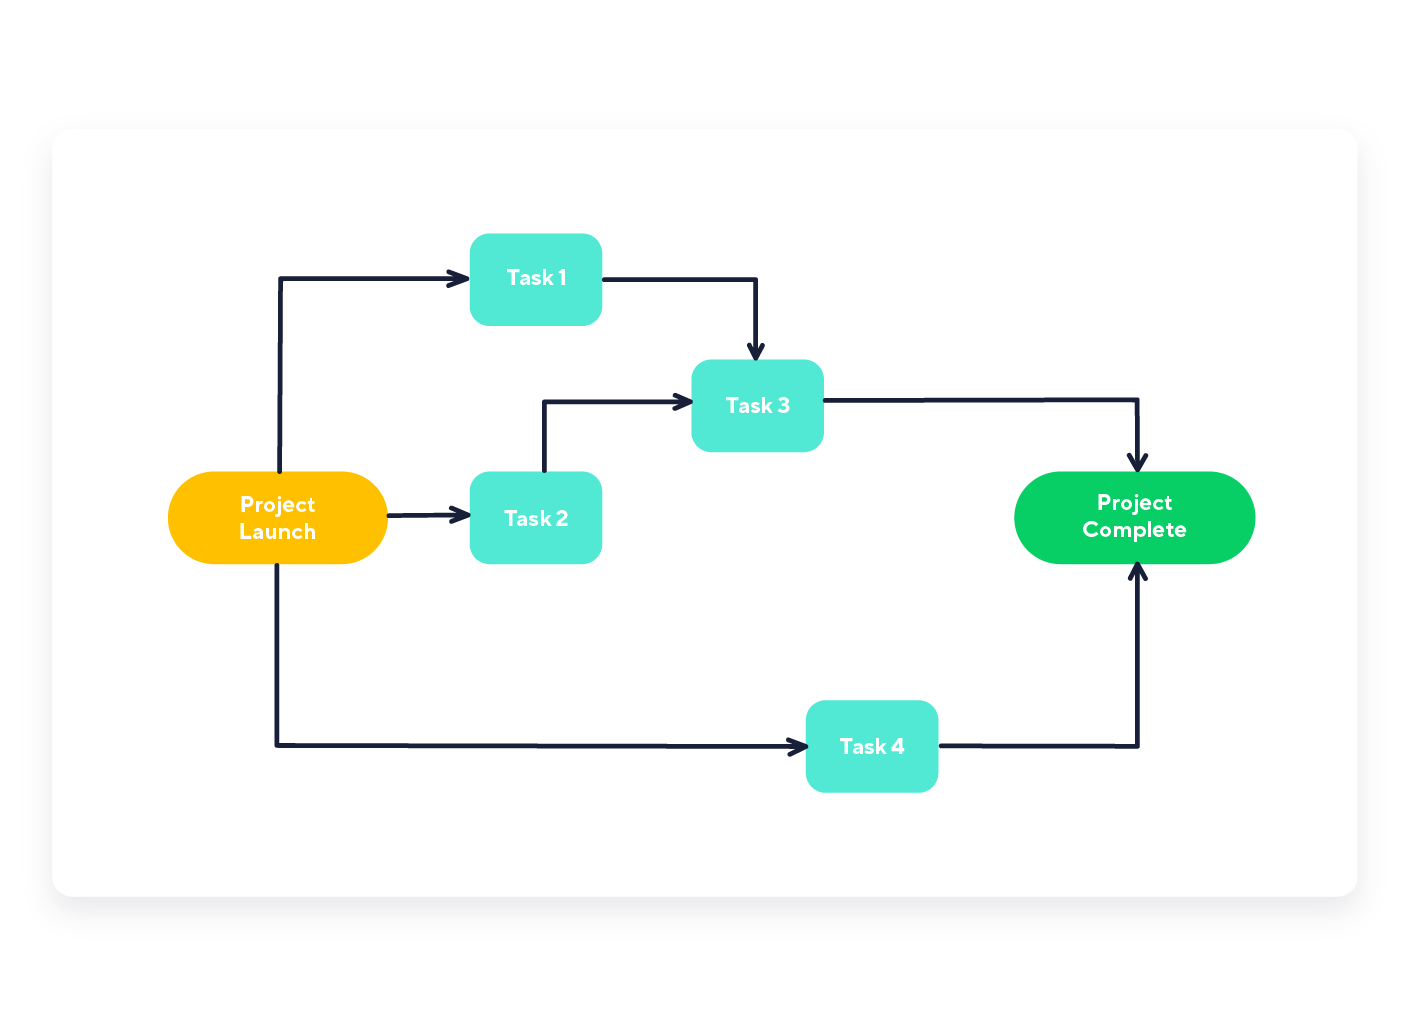
Program Evaluation Review Technique (PERT) is a project management planning tool used to calculate the amount of time it will take to realistically finish a project. PERT charts are used to plan tasks within a project — making it easier to schedule deliverables and coordinate with team members.
PERT charts were created in the 1950s to manage the creation of weapons and defense projects for the US Navy. While PERT was being introduced in the Navy, the private sector simultaneously gave rise to a similar method called critical
What does a PERT chart contain?
PERT is similar to critical path in that they are both used to visualize the timeline and the work that must be done for a project. However with PERT, you create three different time estimates for the project:
- The shortest possible amount of time each task will take
- The most probable amount of time
- The longest amount of time tasks might take if things don't go as planned

PERT is calculated backward from a fixed end date since contractor deadlines typically cannot be moved.
Simplify PERT charts with Wrike
With Wrike, you can effortlessly monitor and document all your task and project timeframes in a central location. That way, when it’s time to produce your estimations for your next PERT chart, you can use ready-made historical data to fill in the best, worst, and most probable task durations.
Additionally, you can identify any changes that occurred and the individuals who worked on the tasks and projects. Once you are done with the planning phase, you can also visualize your project progress and task dependencies with Gantt charts. Unlock your free trial today to take your projects to the next level.
No comments:
Post a Comment