Indian environmental activist wins ‘Green Nobel’ for fighting against mining industry
Associated Press | Gare | April 28, 2014 6:00 pm
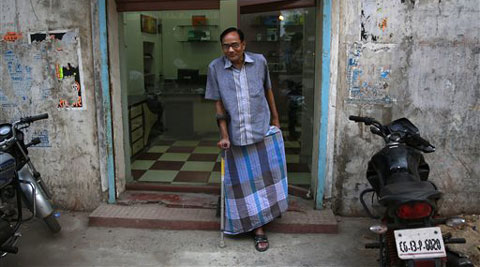 In this April 15, 2014 photo, India's Ramesh Agrawal walks outside his
shop during an interview in Raigarh in Chhattisgarh state, India. (AP)
In this April 15, 2014 photo, India's Ramesh Agrawal walks outside his
shop during an interview in Raigarh in Chhattisgarh state, India. (AP)
Summary
For a decade, Agrawal, who has no formal legal training, has been waging a one-man campaign against the mining industry
Coal ministry panel cancels award of 11 captive blocks
Coal scam: CBI likely to file status report before Supreme Court on October 22
The 2012 attack came three months after Agrawal won a court case that blocked a major Indian company, Jindal Steel & Power Ltd., from opening a second coal mine near the village of Gare in the mineral-rich state of Chhattisgarh.
For a decade, Agrawal, who has no formal legal training, has been waging a one-man campaign to educate illiterate villagers about their rights in fighting pollution and land-grabbing by powerful mining and electricity companies. He’s won three lawsuits against major corporations and has spearheaded seven more pending in courts.
“When I started this fight, I knew I’d be a target. It will happen again. Let it happen. I’m not going anywhere,” the soft-spoken yoga enthusiast said in an interview this month in the city of Raigarh, where he hobbled around his modest home with a cane and a metal brace screwed into his shattered femur.
On Monday, Agrawal, 60, will be recognized in a ceremony in San Francisco as one of six recipients of this year’s $175,000 Goldman Environmental Prize, often called the “Green Nobel.”
Among the other winners are former corporate lawyer Helen Slottje who fought fracking, pumping chemicals and water underground to break open shale rock formations in New York state, and South Africa’s Desmond D’Sa who closed down one of the country’s largest toxic dumping sites. The award was established in 1990 with a grant from philanthropists Richard and Rhoda Goldman to honor grass-roots environmental activists in the six regions of Africa, Asia, Europe, Island Nations, North America and Latin America.
“This is the biggest milestone in my life,” Agrawal said of the award, which he flew to California to receive. “But it also makes me sad, that someone in a foreign country who I don’t even know is willing to do so much for us, while so many people here don’t even know us or want to help.”
Activists, lawyers and analysts in India say that’s changing as hundreds if not thousands of small, scrappy movements are challenging building and mining projects that local residents believe will damage the environment, undermine their livelihoods or even uproot them from their homes.
“People are gaining confidence and losing patience,” environmental lawyer Ritwick Dutta said in New Delhi. “These are not established activist groups or nonprofits like Greenpeace campaigning on global issues like climate change. These are regular, everyday people worried about their survival, and their voices of dissent are forcing India to change.”
Villagers in the central state of Madhya Pradesh have won national TV coverage for thei cause by standing neck-deep in water for days to protest large hydro-power dam projects that would flood their farms and homes. Apple growers in northeast Himachal Pradesh are suing dam builders who they say have tunneling plans that will damage their orchards.
“People used to say, ‘You can’t fight with the big guys.’ But once we started winning a few cases, people started believing in themselves and believing in this country again,” Agrawal said.
India’s rapid economic growth over the past decade has boosted the incomes and living standards of millions, mostly city-dwellers.
But the environmental impact has often been ignored, and the rural poor largely left behind. The 400 million Indians who live on less than Rs 75 a day are dubious about their economic prospects, particularly those who have lost their land or been forced to live with poisoned groundwater, dirty air and fetid rivers.
“Why should these villagers pay for development that is defined by shopping malls and luxury items?” Agrawal asked. “We have to redefine what development means, and decide if it’s for the few or the many.”
Environmental activists are also increasingly facing violence, at least 908 have been killed in 35 countries over the past decade, including six in India, according to a report this month by the London-based Global Witness group.
After he was shot, Agrawal’s attackers turned themselves in, revealing themselves to be Jindal Steel & Power’s security guards. But police never linked the attack with the Indian company.
He also has been jailed for 72 days on what he said were false charges of extortion and defamation that were later dismissed.
In the village of Gare, where Agrawal has helped villagers voice their objections to Jindal’s plans for more mining operations, the earth shakes violently for a half-hour each morning as workmen blast a gaping coal pit with dynamite, sending clouds of black dust billowing up. The acrid smell of smoke hangs in the air, already hazy yellow from the nearby power plant pollution.
The company has been mining coal in the area for several years, but Gare and the neighboring villages of Sarasmal and Kosampali have seen little economic benefit. No new schools or hospital clinics have been built, and only a few dozen menial labor jobs were offered after protests by residents, who were once self-sufficient growing rice and vegetables, villagers said.
There are, however, new roads on which dozens of uncovered coal trucks rattle through communities every day with coal dust blowing off the back.
“For six years I have been sick,” 55-year-old villager Sushila Choudhury said through bloodshot eyes and the wheezing cough of an asthmatic. “Why are they doing this to us? We haven’t done anything wrong.”
Dr. Harihar Patel, the area’s only trained doctor for 10 kilometers (six miles), said he’s seen a jump in the number of people with asthma and other lung ailments, skin lesions and exhaustion.
“The system is not working properly. The rich get richer, and the government supports them over us,” Patel said. “Twenty years ago we had no idea this could happen to us, to our land and our water.”
Agrawal began researching the rights of the poor in confronting corporations in 2005, after becoming alarmed by the sudden influx of industry into his home state of Chhattisgarh. In 2010, he won his first court victory in blocking Indian company Scania Steel & Power Ltd. from expanding a coal-burning power plant without clearance.
He’s been helped by some legal tools along the way. In 2005, India passed a law giving citizens the right to review public records. Six years later, India launched a separate environmental court system that gave any citizen the right to demand a hearing on environmental matters.
Two years ago, the court ruled on a lawsuit filed by Agrawal on behalf of Gare residents to revoke Jindal’s clearance for a second mine in the area. Jindal has since reapplied for clearance to mine in the village, and Agrawal is preparing another suit to block it.
“We have to look after the environment, or there will be hundreds of thousands of people with nothing, no employment, no money, no farmland, no forests,” he said. “They will end up cutting each other’s throats just to survive.”