Wednesday 31 October 2012

Shri Veerappa Moily Assumes Charge as New Petroleum Minister Working towards providing energy security to the People of the country is my priority : Moily

Shri Veerappa Moily Assumes Charge as New Petroleum Minister
Working towards providing energy security to the People of the country is my priority : Moily

Dr. (Shri) M. Veerappa Moily assumed office as new Minister of Petroleum and Natural Gas, here today. He was earlier Minister of Power and Corporate Affairs. Outlining his priorities on the occasion, Shri Moily said that he would work towards providing energy security to the people of India. Bridging the gap in per capita consumption of petroleum products between the global average and bringing it up to a decent level of around 6 barrels/person/year from the present level of 3 barrels is a huge task, he added.

Shri Moily also said that his priorities include intensifying the pace of domestic exploration & production of crude oil & natural gas through new policy initiatives. He emphasised that our oil companies, at the same time will be encouraged to aggressively acquire assets abroad in the interest of energy security.

Elaborating his priorities further, the Minister called for expediting development of oil & gas infrastructure and ensuring availability of sensitive petroleum products, namely Diesel, PDS Kerosene and Domestic LPG at reasonable prices. He also said that efforts will be expedited in channelizing subsidy to the targeted beneficiaries (Direct Cash Transfer). The Minister said that Oil Marketing Companies (OMCs) are incurring high under-recoveries an these sensitive products which present ly come Rs 433 core per day. At this rate, OMCs are expected incur an under-recovery of Rs 1, 63,000 crore this fiscal as compared to Rs 1, 38,500 last year (2011-12). Whereas, about Rs. 60,000 crores of under-recoveries during the current year are likely to be borne by the upstream companies (ONGC, OIL and GAIL), efforts will be made to persuade the Ministry of Finance to compensate the balance under-recoveries, he said.

Shri Moily also referred to encouraging use of natural gas and ensuring upgradation of gas infrastructure in terms of LNG terminals and pipelines. His priorities include Oil PSUs preparing concrete action plans to achieve planned investment of over Rs 4, 50,000 crore during XIIth Five Year Plan, conservation of petroleum products, extension of BS-IV petrol-diesel to major cities, enhancing service standards by OMCs to maximize consumer satisfaction, etc.


***


RCJ/RKS
(Release ID :88686)

Sales promotion and brand equity

As much as marketers keep on harping about the need of maintaining customer relationships and investing millions in establishing a favourable reputation for their brands, they can never turn a deaf ear towards the sales promotion part of the value chain. A sale is an attestation of the fact that the customers actually connect with the brand and trust in the proposition being offered. No wonders, sales managers enjoy handsome salaries owing to the fact that their efforts lead to cash flows in the company and hence play a vital role in the sustenance of the operations of the company.
Brand equity is the worth that the sheer name, symbol and logo, or any tangible or intangible pointer of the brand holds. Every effort that a company with a long term orientation makes contributes in different degrees towards creating the perfect perceptions in the mind of the consumers, hence contributing towards the strengthening of the brand equity. Brands like Coke and McDonald’s rank right at the top in terms of the brand equity. In fact, the value of these brands enables them to keep in growing and maintaining their top ranks in their respective industries.

Cyclone Nilam crosses coast leaving minimal damage

Cyclone Nilam crosses coast leaving minimal damage


  • Gusty winds in Chennai as Cyclone Nilam approaches
According to state officials around 100 trees and some electric poles collapsed due to the strong winds.

Destruction of property was yet to be assessed, but the damage may not be similar to the one inflicted by Cylcone Thane in December last year, state government officials said.

"The storm crossed the coast between 4 p.m. and 6 p.m. Strong winds will continue for another six hours and by Thursday morning everything will calm down," Y.E.A. Raj, deputy director general, India Meteorological Department (IMD) told IANS.

Nevertheless the Tamil Nadu government has declared a holiday for schools and colleges in the coastal districts on Thursday.

"We are experiencing strong winds and not rains. We have not received any complaints about loss of life or damage to properties," a police official in Kalpakkam told IANS over phone.

Mamallapuram, a seventh century port city located near here, is a popular tourist destination for its sculptures and is classified as a UNESCO world heritage site.

On the other hand, neighbouring Kalpakkam is known as nuclear island with a couple of test reactors of India Gandhi Centre for Atomic Research and two units of Madras Atomic Power Station.

According to Raj wind speed touched 75 kmph here and 65 kmph at Kalpakkam.

The state government had taken several precautionary measures like shifting of around 3,900 people living in low lying areas in Mamallapuram to relief camps.

The absence of rain and relative slow wind speed than expectation helped in a major way to reduce the damage, said a state government official. According to government officials, the extent of damage will be known Thursday.

Chennai Corporation had made arrangements to remove the fallen trees immediately.

Chief Minister J. Jayalalithaa reviewed the preventive measures to be taken during the storm while ordering adequate stocks of essential items at relief centres.

Like Tamil Nadu, neighbouring Andhra Pradesh also escaped the Nilam fury. There was no loss of life or property reported from any of the districts in south coastal Andhra Pradesh.

Electricity supply was disrupted in villages under 16 mandals in Nellore district due strong winds. Heavy rains lashed Nellore, Prakasam, Guntur and Chittoor districts.

In Hyderabad, minister for revenue, relief and rehabilitation Raghuveera Reddy, who reviewed the situation with officials Wednesday evening, said the state was not facing any major threat.

The minister, however, said the south coastal districts and the Chittoor district in Rayalaseema region were on alert and taking all measures to prevent loss of life and property. The government deputed three senior officials to Nellore, Chittoor and Prakasam districts to supervise the relief operations.

A team of 47 personnel from National Disaster Response Force were sent to Nellore to take up rescue operations, if required.

The minister said there were no reports of any crop damage. He told reporters that 61 mandals received four cm rainfall during last 24 hours. He said the rains under the influence of the cyclone had benefitted the farmers.

10 Critical Rules for Safe Ladder Setup

10 Critical Rules for Safe Ladder Setup

Working safely on a ladder depends on proper setup. Make sure your employees know the rules.
To avoid ladder accidents, employees have to set up ladders correctly. Be sure to teach them these 10 ladder setup rules.
  • Place the ladder on a firm, level surface, and check to make sure the ladder is stable. Use wide boards under the ladder to give stability if the ground is soft.
  • Never set a ladder on top of a drum, stack of pallets, or other object to gain more height. Use a taller ladder instead. If you set up a ladder on such an unstable base, you're just asking for an accident.
  • Never set up a ladder in front of a door unless the door is locked or blocked—or you've got someone standing on the other side to keep people from opening the door.
  • Never lean a ladder against a surface that isn't strong enough to support your weight, such as a window or an object that might move under your weight.
  • Never fasten two ladders together for additional height. Instead, use a taller ladder or an extension ladder designed for two-ladder coupling.
  • Make sure the spreaders on stepladders are fully extended and locked in place and that locking devices on extension ladders are secured.
  • Remember the 4-to-1 rule: Place the base of the ladder 1 foot from the wall for every 4 feet between the base and the support point. For example, if it is 8 feet from the base of a ladder to its support point, the base of the ladder should be 2 feet away from the building.
  • Extend extension ladders at least 3 feet above a support point such as the edge of a roof.
  • Make sure that the upper section of an extension ladder overlaps and rests on the bottom section. The overlap should always be on the climbing side of the ladder. For ladders of 36 feet or more, the overlap should be least 3 feet.
  • Secure ladders at the top and bottom.

7 Simple Rules for Preventing Falls

  1. Select the right ladder (height and type) for the job.
  2. Inspect ladders carefully before each use.
  3. Follow ladder safety rules and regulations.
  4. Use common sense—only one person on a ladder at a time.
  5. Hold on while your climb and while you work
  6. Don't overreach; get down and move the ladder.
  7. Report safety problems with ladders right away.

Better Design Could Reduce Stepladder Injuries

Researchers from the Human Factors and Ergonomics Society say that not only improved user behavior but also improved ladder design could help decrease the number of stepladder accidents.
Daniel Tichon, Lowell Baker, and Irving Ojalvo explain that compared with a flat surface, stepladders present a smaller and less rigid surface on which to stand and balance.
They suggest manufacturers make stepladders more rigid to provide a stable work platform and offset human balance problems. Front and rear rails could be made of closed tubular sections and cross-shaped spreader bars.
s.


Tuesday 30 October 2012

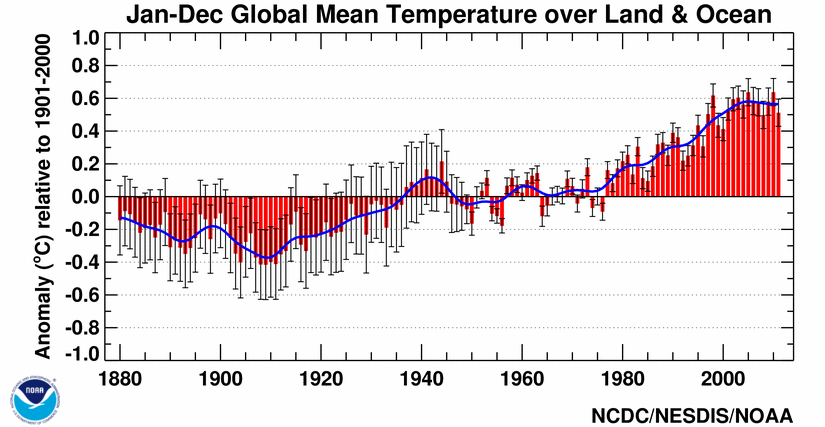
Global Surface Temperature Anomalies

Global Surface Temperature Anomalies

National Oceanic and Atmospheric Administration

National Climatic Data Center


Note: Effective September 2012, the GHCN-M version 3.2.0 dataset of monthly mean temperature replaced the GHCN-M version 3.1.0 monthly mean temperature dataset. Beginning with the August 2012 Global monthly State of the Climate Report, released on September 17, 2012, GHCN-M version 3.2.0 is used for NCDC climate monitoring activities, including calculation of global land surface temperature anomalies and trends. For more information about this newest version, please see the GHCN-M version 3.2.0 Technical Report.
*The GHCN-M version 3.1.0 Technical Report was revised on September 5, 2012 to accurately reflect the changes incorporated in that version. Previously that report incorrectly included discussion of changes to the Pairwise Homogeneity Algorithm (PHA). Changes to the PHA are included in version 3.2.0 and described in the version 3.2.0 Technical Report. Please see the Frequently Asked Questions to learn more about this update.

Background Information - FAQ
  1. What is a temperature anomaly?
    The term temperature anomaly means a departure from a reference value or long-term average. A positive anomaly indicates that the observed temperature was warmer than the reference value, while a negative anomaly indicates that the observed temperature was cooler than the reference value.
  2. What can the mean global temperature anomaly be used for?
    This product is a global-scale climate diagnostic tool and provides a big picture overview of average global temperatures compared to a reference value.
  3. What datasets are used in calculating the average global temperature anomaly?
    Land surface temperatures are available from the Global Historical Climate Network-Monthly (GHCN-M). Sea surface temperatures are determined using the extended reconstructed sea surface temperature (ERSST) analysis. ERSST uses the most recently available International Comprehensive Ocean-Atmosphere Data Set (ICOADS) and statistical methods that allow stable reconstruction using sparse data. The monthly analysis begins January 1854, but due to very sparse data, no global averages are computed before 1880. With more observations after 1880, the signal is stronger and more consistent over time.
  4. What version of the GHCN-M analysis is currently being used?
    Effective September 2012, the GHCN-M version 3.2.0 dataset of monthly mean temperature replaced the GHCN-M version 3.1.0 monthly mean temperature dataset. Beginning with the August 2012 Global monthly State of the Climate Report, GHCN-M version 3.2.0 is used for NCDC climate monitoring activities, including calculation of global land surface temperature anomalies and trends. For more information about this newest version, please see the GHCN-M version 3.2.0 Technical Report. Please note that the GHCN-M version 3.1.0 Technical Report was revised on September 5, 2012 to accurately reflect the changes incorporated in that version. Previously that report incorrectly included discussion of changes to the Pairwise Homogeneity Algorithm (PHA). Changes to the PHA are included in version 3.2.0 and described in the version 3.2.0 Technical Report. Please see the Frequently Asked Questions to learn more about this update.
  5. What version of the ERSST analysis is currently being used?
    ERSST version 3b is currently used. ERSST version 3 improved upon version 2 in several ways: first, by changing the low-frequency tuning, effectively increasing the sensitivity to data prior to 1930; by internally handling sea ice calculations to increase the timeliness of the dataset; and by using satellite observations to increase data where in-situ measurements are sparse (Smith et al., 2008). In version 3b, the satellite observations were removed from the product because they were found to have introduced a bias that caused problems for many of our users. The bias was strongest in the middle and high latitude Southern Hemisphere where in-situ (ship and buoy) observations are sparse. More detailed information about the switch to version 3b.
  6. When was the use of the ERSST version 3b implemented?
    The transition to the new ERSST version (3b) occurred in November 2008. The Climate Monitoring Branch began using the updated merged land-ocean dataset for the July 2009 State of the Climate Report. The changes were previewed in the May and June 2009 State of the Climate reports to caution users.
  7. Why use temperature anomalies (departure from average) and not absolute temperature measurements?
    Absolute estimates of global average surface temperature are difficult to compile for several reasons. Some regions have few temperature measurement stations (e.g., the Sahara Desert) and interpolation must be made over large, data-sparse regions. In mountainous areas, most observations come from the inhabited valleys, so the effect of elevation on a region’s average temperature must be considered as well. For example, a summer month over an area may be cooler than average, both at a mountain top and in a nearby valley, but the absolute temperatures will be quite different at the two locations. The use of anomalies in this case will show that temperatures for both locations were below average.
    Using reference values computed on smaller [more local] scales over the same time period establishes a baseline from which anomalies are calculated. This effectively normalizes the data so they can be compared and combined to more accurately represent temperature patterns with respect to what is normal for different places within a region.
    For these reasons, large-area summaries incorporate anomalies, not the temperature itself. Anomalies more accurately describe climate variability over larger areas than absolute temperatures do, and they give a frame of reference that allows more meaningful comparisons between locations and more accurate calculations of temperature trends.
  8. How is the average global temperature anomaly time-series calculated?
    The global time series is produced from the Smith and Reynolds blended land and ocean data set (Smith et al., 2008). This data set consists of monthly average temperature anomalies on a 5° x 5° grid across land and ocean surfaces. These grid boxes are then averaged to provide an average global temperature anomaly. An area-weighted scheme is used to reflect the reality that the boxes are smaller near the poles and larger near the equator. Global-average anomalies are calculated on a monthly and annual time scale. Average temperature anomalies are also available for land and ocean surfaces separately, and the Northern and Southern Hemispheres separately. The global and hemispheric anomalies are provided with respect to the period 1901-2000, the 20th century average.
  9. Why do some of the products use different reference periods?
    The maps show temperature anomalies relative to the 1981–2010 base period. This period is used in order to comply with a recommended World Meteorological Organization (WMO) Policy, which suggests using the latest decade for the 30-year average. For the global-scale averages (global land and ocean, land-only, ocean-only, and hemispheric time series), the reference period is adjusted to the 20th Century average for conceptual simplicity (the period is more familiar to more people, and establishes a longer-term average). The adjustment does not change the shape of the time series or affect the trends within it.
  10. How often and when is the global average temperature dataset updated?
    The dataset is updated every month. Data for a month are typically made available by the 15th of the following month.
  11. What is the difference between the gridded dataset and the index values?
    The land and ocean gridded dataset is a large file (~24 mb) that contains monthly temperature anomalies across the globe on a 5 deg x 5 deg grid. The anomalies are calculated with respect to the 1981–2010 base period. Gridded data is available for every month from January 1880 to the most recent month available. You can use it to examine anomalies in different regions of the earth on a month-by-month basis. The index values are an average of the gridded values (see question #7); however, the anomalies are provided with respect to the 20th century (1901–2000) average. They are most useful for tracking the big-picture evolution of temperatures across larger parts of the planet, up to and including the entire global surface temperature.

Global Mean Monthly Surface Temperature Estimates for the Base Period 1901 to 2000


Land Surface
Mean Temp.
J F M A M J J A S O N D Annual
1901 to 2000 (°C) 2.8 3.2 5.0 8.1 11.1 13.3 14.3 13.8 12.0 9.3 5.9 3.7 8.5
1901 to 2000 (°F) 37.0 37.8 40.8 46.5 52.0 55.9 57.8 56.9 53.6 48.7 42.6 38.7 47.3
Sea Surface
Mean Temp.
J F M A M J J A S O N D Annual
1901 to 2000 (°C) 15.8 15.9 15.9 16.0 16.3 16.4 16.4 16.4 16.2 15.9 15.8 15.7 16.1
1901 to 2000 (°F) 60.5 60.6 60.7 60.9 61.3 61.5 61.5 61.4 61.1 60.6 60.4 60.4 60.9
Combined Mean
Surface Temp.
J F M A M J J A S O N D Annual
1901 to 2000 (°C) 12.0 12.1 12.7 13.7 14.8 15.5 15.8 15.6 15.0 14.0 12.9 12.2 13.9
1901 to 2000 (°F) 53.6 53.9 54.9 56.7 58.6 59.9 60.4 60.1 59.0 57.1 55.2 54.0 57.0

Gridded Dataset Please note that the gridded file has been updated to reflect the recent changes in the GHCN-M Temperature Dataset. For more information, please see the GHCN-M version 3.2.0 Technical Report.
To obtain a copy of the monthly average temperature anomalies on a 5° x 5° grid across land and ocean surfaces, please use the following information to access anonymous FTP at NCDC:

Machine Address: ftp.ncdc.noaa.gov
Login Name: anonymous
Password: your email address
Directory: /pub/data/ghcn/blended/
Enter: bin
Enter: get ncdc-merged-sfc-mntp.dat.gz
For information on the format of the dataset, please visit our Global Historical Climatology Network page. A direct link to the file is also provided on the website.

The Global Anomalies and Index Data
Please Note: Anomalies are provided as departures from the 20th century average (1901-2000).
Monthly and annual global anomalies are available through the most recent complete month and year, respectively.
PLEASE NOTE: Effective September 2012, the GHCN-M version 3.2.0 dataset of monthly mean temperature replaced the GHCN-M version 3.1.0 monthly mean temperature dataset. Beginning with the August 2012 Global monthly State of the Climate Report, GHCN-M version 3.2.0 is used for NCDC climate monitoring activities, including calculation of global land surface temperature anomalies and trends. For more information about this newest version, please see the GHCN-M version 3.2.0 Technical Report.

Additional Websites

References
Peterson, T. C., and R. S. Vose (1997), An Overview of the Global Historical Climatology Network Temperature Database, Bull. Am. Meteorol. Soc., 78, 2837-2849.
Quayle, R.G., T.C. Peterson, A.N. Basist, and C.S. Godfrey, 1999: An operational near-real-time global temperature index. Geophys. Res. Lett.. 26, 3 (Feb. 1, 1999), 333-335.
Smith, T. M., and R. W. Reynolds (2004), Improved extended reconstruction of SST (1854-1997), J. Climate, 17, 2466-2477.
Smith, T. M., and R. W. Reynolds (2005), A global merged land air and sea surface temperature reconstruction based on historical observations (1880-1997), J. Climate, 18, 2021-2036.
Smith, T. M., et al. (2008), Improvements to NOAA's Historical Merged Land-Ocean Surface Temperature Analysis (1880-2006), J. Climate, 21, 2283-2293.
The complete land-sea surface climatology from the Climate Research Unit is described in:
Jones, P. D., M. New, D. E. Parker, S. Martin, and I. G. Rigor (1999), Surface Air Temperature and its Changes Over the Past 150 Years, Rev. Geophys., 37(2), 173—199.
Global land areas, excluding Antarctica, described in:
New, M. G., M. Hulme and P. D. Jones, in press: Representing 20th century space-time climate variability. I: Development of a 1961-1990 mean monthly terrestrial climatology. J. Climate.
Global oceans, 60S-60N, described in:
Parker, D. E., M. Jackson and E. B. Horton, 1995: The GISST2.2 sea surface temperature and sea-ice climatology. Climate Research Technical Note, CRTN 63, Hadley Centre for Climate Prediction and Research, Bracknel, UK.
Arctic sea areas, described in:
Rigor, I. G., R. L. Colony and S. Martin, submitted: Statistics of surface air temperature observations in the Arctic. J. Climate.
Martin, S. and E.A. Munoz: Properties of the Arctic 2-Meter Air temperature field for 1979 to the present derived from a new gridded data set. J. Climate, 10, 1428-1440

Link between cyclones, climate change unclear: Scientists

Was Hurricane Sandy caused by climate change?
This was the contention today of Andrew Cuomo, governor of New York state, which bore the brunt of the superstorm.
“Anyone who thinks there isn’t a change in weather patterns is denying reality,” he said.
Many climate scientists would agree with Cuomo when it comes to identifying the cause of the record-breaking droughts and floods of recent years.
But when it comes to tropical storms, the experts also say they cannot give a black-or-white answer for one of the most complex issues in meteorology.
Tropical storms are fuelled by warm seas, so intuition says that as ocean temperatures rise, hurricanes — known as typhoons in Asia — should become more frequent and more brutal.
But a clear rise in Earth’s surface temperature since the 1970s has so far failed to engender a similar increase in tropical cyclone numbers, which have remained stable at about 90 per year.
In the Atlantic alone, however, the US National Oceanic and Atmospheric Administration (NOAA) says major storms have become more frequent and intense since 1995.
The agency also warns that science right now cannot tease out how much of the change should be attributed to natural climate variability, and how much to man-made warming.
As for the future, experts give conflicting or sketchy predictions of what could happen this century, when surface temperatures are predicted to warm two or three degrees Celsius (3.5 to five degrees Fahrenheit).
“There is some evidence to suggest that with climate change we might see stronger wind speeds but that the overall number of tropical cyclones (will show) no change or maybe even go down a little bit,” said Tom Mitchell, head of climate change at Britain’s Overseas Development Institute.
Serge Planton, head of climate research at French weather forecasting service Meteo France, explained why the picture is so fuzzy. “It’s a very complex phenomenon,” he said.
“A cyclone depends not only on the sea surface temperature, but also on the structure of the winds at every layer of the atmosphere. This means it does not respond in a simple, linear fashion to climate change.”
When it comes to storm surge, there seems to be more scientific consensus that climate change’s impact is clear.
Sandy’s swells were entirely consistent with scenarios sketched by the UN’s Intergovernment Panel on Climate Change in a report on extreme weather events, published in March, contended Mitchell.

Procedure for the qualification of vendors for the raw material and packaging materials

Procedure for the qualification of vendors for the raw material and packaging materials


Procedure for inclusion of vendor in approved vendor list (Raw materials)New vendors must be qualified and approved by QA department before regular supply of raw materials in following manner.Purchase department will locate the new vendor and find out the details of products manufactured / supplied by them.  In case of existing materials, Purchase department will provide our specification to the new vendor.Purchase department will submit the samples to QA department or R&D department for evaluation as per specifications.Samples from 3 consecutive lots / batches of active ingredient should be procured as pre-shipment sample along with certificate of analysis.  For active as well as excipients, Assurance / Declaration of compliance with TSE / BSE requirement or material is of vegetable origin shall be taken from the manufacturer.  Quality Assurance or R&D department should analyse the sample.After complete analysis of the sample, the analytical report along with the comments of QA department shall be sent to Purchase department.   The vendor will be included in the temporary approved vendor list if the samples are meeting the specifications.  The new addition to the list are entered manually and approved by Head QA & QC till the list is amended.Purchase department after studying the comments of QA department shall inform the supplier for the supply of the material manufactured by them.An audit is performed by representative of Purchase department, QA department and GMP Cell.a)      Active Raw Material / Excipients vendor audit report shall be prepared.b)      A supplier questionnaire is sent to suppliers. c)      However the visit and audit of vendor shall not be considered as an approving criteria and based on the previous history, background and quality trial lots supplied by the supplier, the vendor may be included in approved vendor list.Purchase department shall carefully study the quality aspect and also the quantity and financial aspects of the vendor, they are as follows;a)  Capability of the vendor to supply the required material within the period.b)      Delivery schedule in order not to affect the production cycle.c)  The rates quoted by the vendor whether they are competitive with respect to other vendors without compromising the quality aspects.Based on the product compliance and assessment, further procurement of active raw material should be continued.  On ensuring compliance with specifications the vendor shall be included in permanent vendor’s list during update of list.

All the suppliers evaluated by R&D department on the basis of process / product development parameters shall be considered as temporary vendors and will be included in temporary approved vendor list.  Based on the commercial production supply, they will be transferred to approved vendor list and shall be considered as permanent approved vendors.Vendors recommended by R&D having drug master file number shall be included as temporary vendors and based on the performance on commercial supply for production batches, will be transferred to approved vendor list.Vendors approved by the product licence holder or contract giver will be listed separately as approved for product licence holder products
.Procedure for inclusion of vendor in approved vendor list (Packaging material)New vendors must be qualified and approved by QA department before regular supply of packaging materials in following manner.Purchase department will locate the new vendor and find out the details of products manufactured / supplied by them.  In case of existing materials, Purchase department will provide our specification to the new vendor.For printed and primary packaging materials, vendor audit is performed by representative of Purchase department, QA department and GMP Cell.Samples of printed packaging materials if necessary will be submitted to QA department for evaluation. Purchase department after studying the comments of QA department shall inform the supplier for the supply of the material manufactured by them.Purchase department shall carefully study the quality aspect and also the quantity and financial aspects of the vendor, they are as follows;a)      Capability of the vendor to supply the required material within the period.b)      Delivery schedule in order not to affect the production cycle.c)      The rates quoted by the vendor whether they are competitive with respect to other vendors without compromising the quality aspects.Based on the product compliance and assessment, further procurement of packaging material should be continued.  On ensuring compliance with specifications the vendor shall be included in permanent vendor’s list during update of list.All the suppliers evaluated by R&D department on the basis of process / product development parameters shall be considered as temporary vendors and will be included in temporary approved vendor list.  Based on the commercial production supply, they will be transferred to approved vendor list and shall be considered as permanent approved vendors.
Procedure for exclusion of vendor from approved vendor list The vendor shall be disqualified and removed from the approved vendor’s list for the following reasons :a)      If a lot  does not comply to the specification with respect to critical tests then the vendor shall be disqualified. The vendor shall be qualified again on further evaluation and investigation.b)      If a lot  does not comply to the specification with respect to minor tests then the vendor shall be disqualified if it is observed for 3 consecutive  lots.c)      3 out of 10 lots fail to comply the specification in a specified period under review.d)      The delivery schedule is not met for 40% supplies.The rates mentioned in Purchase Order, differs than the rates mentioned in delivery challan and invoice. 
Corrective and preventive action
The vendor, who has been excluded from the approved vendor’s list, may be included again by taking following corrective and preventive actions;The vendor shall be made aware of the reasons for his exclusion and shall be asked to explain.Head  Purchase and Head QA&QC shall conduct facility audit of the vendor in order to ensure that quality system exists in the organization.Carry out the discussion on other non-quality issues like delivery schedule and rate, etc.After satisfactory compliance of all above points, the vendor shall be included in Temporary Vendor List.

Qualification of systems and equipments in laboratory

Qualification of systems and equipments in laboratory

1. Principle

2. Scope

3. General

4. Design qualification

5. Installation qualification

6. Operational qualification

7. Performance qualification

8. Requalification

9. Qualification of “in use” systems and equipment

1. Principle

1.1 Systems and equipment should be appropriately designed, located, installed, operated and maintained to suit their intended purpose.

1.2 Critical systems, i.e. those whose consistent performance may have an impact on the quality of products, should be qualified. These may include, where appropriate, water purification systems, air-handling systems, compressed air systems and steam systems.

1.3 The continued suitable performance of equipment is important to ensure batch-to-batch consistency. Critical equipment should therefore be qualified.

2. Scope

2.1 These guidelines describe the general aspects of qualification for systems and equipment.

2.2 Normally qualification would be applicable to critical systems and equipment whose performance may have an impact on the quality of the product.

3. General

3.1 The manufacturer should have a qualification policy for systems and equipment.

3.2 Equipment (including instruments) used in production and quality control should be included in the qualification policy and programme.

3.3 New systems and equipment should pass through all stages of qualification including design qualification (DQ), installation qualification (IQ), operational qualification (OQ) and performance qualification (PQ) as appropriate (Fig. 1).

3.4 In some cases, not all stages of qualification may be required.

3.5 Systems should be qualified before equipment.

3.6 Equipment should be qualified prior to being brought into routine use to provide documented evidence that the equipment is fit for its intended purpose.

3.7 Systems and equipment should undergo periodic requalification, as well as requalification after change.

3.8 Certain stages of the equipment qualification may be done by the supplier or a third party.

3.9 The relevant documentation associated with qualification including tandard operating procedures (SOPs), specifications and acceptance criteria, certificates and manuals should be maintained.

3.10 Qualification should be done in accordance with predetermined and approved qualifi cation protocols. The results of the qualification should be recorded and reflected in qualification reports.

3.11 The extent of the qualification should be based on the criticality of a system or equipment (e.g. blenders, autoclaves or computerized systems).

4. Design qualification

Note: see also “Supplementary guidelines on good manufacturing practices (GMP): validation”.

4.1 User requirements should be considered when deciding on the specific design of a system or equipment.

4.2 A suitable supplier should be selected for the appropriate system or equipment (approved vendor).

5. Installation qualification

Note: see also “Supplementary guidelines on good manufacturing practices (GMP): validation”.

5.1 Systems and equipment should be correctly installed in accordance with an installation plan and installation qualification protocol.

5.2 Requirements for calibration, maintenance and cleaning should be drawn up during installation.

5.3 Installation qualification should include identifi cation and verification of all system elements, parts, services, controls, gauges and other components.

5.4 Measuring, control and indicating devices should be calibrated against appropriate national or international standards, which are traceable.

5.5 There should be documented records for the installation (installation qualification report) to indicate the satisfactoriness of the installation, which should include the details of the supplier and manufacturer, system or equipment name, model and serial number, date of installation, spare

parts, relevant procedures and certificates.

6. Operational qualification

Note: see also “Supplementary guidelines on good manufacturing practices (GMP): validation”.

6.1 Systems and equipment should operate correctly and their operation should be verified in accordance with an operational qualification protocol.

6.2 Critical operating parameters should be identifi ed. Studies on the critical variables should include conditions encompassing upper and lower operating limits and circumstances (also referred to as “worst case conditions”).

6.3 Operational qualifi cation should include verification of operation of all system elements, parts, services, controls, gauges and other components.

6.4 There should be documented records for the verification of operation (operational qualification report) to indicate the satisfactory operation.

6.5 Standard operating procedures for the operation should be finalized and approved.

6.6 Training of operators for the systems and equipment should be provided, and training records maintained.

6.7 Systems and equipment should be released for routine use after completion of operational qualification, provided that all calibration, cleaning, maintenance, training and related tests and results were found to be acceptable.

7. Performance qualification

Note: see also “Supplementary guidelines on good manufacturing practices (GMP): validation”.

7.1 Systems and equipment should consistently perform in accordance with design specifications. The performance should be verified in accordance with a performance qualification protocol.

7.2 There should be documented records for the verification of performance (performance qualification report) to indicate the satisfactory performance over a period of time. Manufacturers should justify the selected period over which performance qualification is done.

8. Requalification

Note: see also “Supplementary guidelines on good manufacturing practices (GMP): validation”.

8.1 Requalification of systems and equipment should be done in accordance with a defined schedule. The frequency of requalification may be determined on the basis of factors such as the analysis of results relating to calibration, verification and maintenance.

8.2 There should be periodic requalification.

8.3 There should be requalification after changes. The extent of requalification after the change should be justified based on a risk-assessment of the change. Requalification after change should be considered as part of the change control procedure.

9. Qualification of “in-use” systems and equipment

9.1 There should be data to support and verify the suitable operation and performance of systems and equipment that have been “in use” for a period of time, and which had not been subjected to installation and or operational qualification.

9.2 These should include operating parameters and limits for critical variables, calibration, maintenance and preventive maintenance, standard operating procedures (SOPs) and records.

Analytical Method Validation With Definitions

Analytical Method Validation With Definitions


1. Accuracy

The accuracy of an analytical method is the closeness of test results obtained by that method to the true value.  The accuracy of an analytical method should be established across its range.
2. Precision

The precision of an analytical method is the degree of agreement among individual test results when the method is applied repeatedly to multiple samplings of a homogeneous sample.
3. Specificity

The specificity of an analytical method is the ability to assess unequivocally the analyte in the presence of components that may be expected to be present, such as impurities, degradation products, and matrix components.
4. Detection Limit

The detection limit of an analytical method is the lowest amount of analyte in a sample that can be detected, but not necessarily quantitated, under the stated experimental conditions.

5. Quantitation Limit

The quantitation limit of an analytical method is the lowest amount of analyte in a sample that can be determined with acceptable precision and accuracy under the stated experimental conditions.

6. Ruggedness (Intermediate precision)

The ruggedness of an analytical method is the degree of reproducibility of test results obtained by the analysis of the same samples under a variety of conditions, such as different laboratories, different analysts, different instruments, different lots of reagents, different elapsed assay times, different assay temperatures, different days, etc.  Ruggedness is normally expressed as the lack of influence on the test results of operational and environmental variables of the analytical method.  Ruggedness is a measure of reproducibility of test results under the variation in conditions normally expected from laboratory to laboratory & from analyst to analyst.
7. Linearity

The linearity of an analytical method is its ability to elicit test results that are directly, or by a well-defined mathematical transformation, proportional to the concentration of analyte in samples within a given range.
8. Range

The range of an analytical method is the interval between the upper & lower levels of analyte (including these levels) that have been demonstrated to be determined with a suitable level of precision, accuracy, & linearity using the method as written.
9. Robustness
It is the reliability of an analysis with respect to deliberate variations in method parameters.
Examples of typical variations are :
Stability of analytical solutions.
extraction time.
pH of mobile phase.
different column makes.
Temperature.
Flow rate.

National Cyclone Risk Mitigation Project (NCRMP)

 About NCRMP
Indian coasts are highly vulnerable to tropical cyclones and consequent recurrent loss of life and properties. It is now well recognized that by taking long and short term mitigation measures, the loss of life and properties can be minimized. Hazard risk mitigation is key to sustainable development and this has been the policy of Government of India, which lays greater emphasis on prevention, preparedness and mitigation. With this in view, Ministry of Home Affairs (MHA), Government of India conceptualized a comprehensive National Cyclone Risk Mitigation Strategy through several consultations, ending with a National workshop, "Developing Strategy for Cyclone Mitigation in the Coastal & Island Regions of India", held during Feb. 4-5, 2003 at the Administrative Training Institute, Kolkata. This strategy will be a part of the Multi-hazard Mitigation Plan being developed at the National level. To give effect to the strategic interventions, the Ministry of Home Affairs decided to put in place the "National Cyclone Risk Mitigation Project". After the formation of National Disaster Management Authority (NDMA), the management of the Project was transferred to NDMA in September, 2006.
The overall objective of the National Cyclone Risk Mitigation Project ('NCRMP') is to minimize vulnerability to cyclones and make people and infrastructure disaster resilient in harmony with the conservation of the coastal eco-system in the cyclone hazard prone States and Union Territories of India. National Disaster Management Authority ('NDMA') under the aegis of Ministry of Home Affairs (MHA) will implement the Project in collaboration with Governments of Andhra Pradesh and Orissa, and the National Institute for Disaster Management in the first phase. The Project costing Rs 1496.71 crores (US $ 308.60 million) is to be funded by the World Bank (International Development Association credit) as an Adaptable Program Loan to be scaled up to US $ 969 million for covering the other States and UT's based on their readiness to implement the Project. The Project is proposed as a Centrally Sponsored Scheme with 75% contribution (for Component B of the Project) by the Central Government, as grant-in-aid and a matching 25% contribution by the State Governments. Other components will be funded 100% by the Central Government, as grant-in-aid. Planning Commission has given in principle approval for the Project and the Project is included in the 11th five year plan.Aims & Objectives
1. Mission Statement: The National Cyclone Risk Mitigation Project seeks to minimize vulnerability in the cyclone hazard prone States and Union Territories of India and make people and infrastructure disaster resilient, in harmony with conservation of the coastal eco-system.
2. Key Objectives: The Project aims to fulfil its Mission by undertaking following structural and non structural measures:
(i). Strengthening cyclone warning systems by improving the last mile connectivity for dissemination of early warnings and advisories from authorities to communities and to receive feedback from communities by the authorities.
(ii). Construction and sustainable maintenance of multi-purpose cyclone shelters.
(iii). Construction of connecting roads and bridges.
(iv). Construction of coastal embankments in selected places to stop saline ingress to protect crops, vital property and population.
(v). Shelterbelt plantation and mangrove plantation/regeneration.
(vi). Detailed Hazard, Vulnerability and Risk Assessment studies of coastal districts, provide technical assistance for preparing high priority risk mitigation investments, preparation of long term training and capacity building strategy, and strengthening institutional capacity for damage and loss assessment.
(vii). Strengthening community level preparedness and building the capacity of the communities to manage disasters as the first responders. Identify support and other stakeholders and build their capacities for coordinated and systematic response and mitigation measures. Awareness generation regarding preparedness and mitigation measures.

Historical records of 12 most devastating cyclones, which formed in the Bay of Bengal and made landfall on the East coast of India

Historical records of 12 most devastating cyclones, which formed in the Bay of Bengal and made landfall on the East coast of India  
S.No Date/ Year Category of cyclone Landfall and Relevant Information
1. 7-12 October, 1737 Super Cyclone* Crossed West Bengal coast over Sunderbans
Surge height: 12 m
Loss of life: 300,000
2. 31 October, 1831 Very Severe Cyclonic Storm* Crossed Orissa coast near Balasore
Surge Height: 2-5 m
Loss and Damage: People Killed=22,000, Cattleheads lost=50,000
3. 2-5 October, 1864 Very Severe Cyclonic Storm* Cross the coast near Contai, West Bengal
Surge Height: The wave in many places rose to 9 m The Maximum height of the waves reached 12 m
At Sagar Island it was 5 m above land level. At Diamond Harbour, the wave was 3 m
Loss and Damage: People Killed=50,000 (mostly due to drowning), and 30,000 (due to diseases as a result of inundation)
4. 1-2 November, 1864 Severe Cyclonic Storm* Crossed Andhra Pradesh coast near Machili-patnam
Surge-Height: 4 m
Loss and Damage: People Killed=30,000
5. 22 September, 1885 Super Cyclone* Crossed Orissa coast at False Point,
Central pressure: 919 hPa,
Surge Height: 7 m
Loss of Life: 5000
6. 14-16 October, 1942 Severe Cyclonic Storm Crossed West Bengal coast near Contai
Surge Height: 3-5 m
Loss and Damage: People Killed=19,000,
Cattleheads killed=60,000
7. 8-11 October, 1967 Severe Cyclonic Storm Crossed Orissa coast between Puri and Paradip on the morning of 9 October and then crossed Bangladesh coast during the night of 10-11 October
Loss and Damage: People Killed=1,000, Cattleheads lost=50,000; property of few crores of rupees damaged
8. 26-30 October, 1971 Severe Cyclonic Storm Crossed Orissa coast near Paradip early morning of 30 October
Maximum Wind: 150-170 kmph (81-92 kts)
Surge height: 4-5 m, north of Chandbali
Loss and Damage: People killed=10,000; Cattleheads lost=50,000; Houses damaged=8,00,000
9. 14-20 November, 1977 Super Cyclone* Crossed Andhra coast near Nizamparnam at 1730 IST on 19 November
Maximum wind: Ongole recorded 102 kmph (55 kts); Machilipatnam recorded 120 kmph (65 kts); Gannavaram recorded 139 kmph (75 kts)
Surge Height: 5 m
Intensity: T 7.0
Maximum estimated wind speed: 260 kmph (140 kts)
Loss and Damage: People killed=10,000; Cattleheads lost=27,000; Damage to crops and other property was estimated to be around Rs. 350 crores.
10. 4-11 May, 1990 Super Cyclone* Crossed Andhra coast at about 40 km south west of Machilipatnam around 1900 IST of 9 May
Maximum wind: Machilipatnam recorded 102 kmph (55 kts); Gannavaram recorded 93 kmph (50 kts)
Surge height:4-5m
Intensity: T 6.5
Maximum estimated wind speed : 235 kmph (126 kts)
Loss and damage: People killed=967; the estimated cost of the damages to crops and properties= Rs.2,248 crore
11. 5-6 November, 1996 Very Severe Cyclonic Storm* Crossed Andhra coast near Kakinada at midnight of 6 November
Maximum wind: 200 kmph (108 kts )
Surge height:3-4 m
Loss and damage: People killed=2000;
People missing=900;crops destroyed in 3,20,000 hectares of land; house destroyed=10,000
Estimate of the loss for crops= Rs.150 crores
12. 25-31 November, 1999 Super Cyclone Crossed Orissa coast near Paradip at noon of 29 October
Maximum wind: 260 kmph (140 kts); Bhubaneshwar recorded 148 kmph (80 kts)
Surge height : 6-7m
Intensity : T 7.0
Loss and damage : People killed=8,960;
People injured = 2,142; cattleheads perished=3,70,297;
Paddy crops in 16,17,000 hectares and other crops in 33,000 hectares damaged.
* Severe Cyclonic Strom with core of hurricane winds as per earlier categorization

Historical records of 11 most devastating cyclones which formed in the Arabian Sea and made landfall on the West coast of India

Historical records of 11 most devastating cyclones which formed in the Arabian Sea and made landfall on the West coast of India
S.No. Date/Year Type of Disturbance Landfall and Relevant Information
1. 16, May 1618 Severe Cyclonic Storm Crossed Bombay
Loss and damage: People killed=2,000
2. 30 October-2 November, 1854 Severe Cyclonic Storm Crossed Bombay coast on 1 Novenber
Loss and damage: People killed=1,000
Property worth crores of rupees perished within four hours
3. 18-23 November, 1948 Severe Cyclonic Storm Crossed coast near Virar, 72 km North of Bombay at about 0830 hrs IST on 22 November.
Maximum wind: Colaba recorded 120 kmph (65 kts) and Juhu recorded 151 Kmph (81 kts)
Loss and damage: Great havoc and heavy loss of life and property and all means of traffic and communication  were completely paralysed for two days.A number of small vessels and crafts capsized in the water of the Bombay harbour. Thousands of big trees uprooted and hundred of buildings and hutments were rendered uninhabitable
4. 23-25 May, 1961 Severe Cyclonic Storm Crossed coast near Devgad on the night of 24 to 25 May
Loss and damage: 5 lakh fruit trees were reported to have been razed to the ground.1,700 houses completely and 25,000 houses partially damaged
5. 9-13 June, 1964 Severe Cyclonic Storm Crossed coast just west of Naliya during the late forenoon on 12 June
Maximum wind: Naliya recorded 135 kmph (73 kts);Dwarka recorded 105 kmph (57 kts); Porbandar recorded 74 kmph (40 kts); Veraval recorded 83 kmph (45 kts);
Surge height: 2m at Kandla
Loss and damage: People killed=27
6. 19-24 October, 1975 Very Severe Cyclonic Storm* Crossed Saurashtra coast about 15 km to the northwest of Porbandar at 1500 hours IST of 22 October
Maximum wind: Jamnagar recorded 160-180 kmph (86-97 kts) and Porbandar recorded 110 kmph (59 kts)
Surge height: 4-6 m at Porbandar and Okha
Intensity:T 6.0
Loss and damage: People killed=85; Several thousands of houses were damaged; Many trees/ electric/telephone poles/roof tops blew; A train was also blown off its rails; loss of property was estimated to be Rs. 75 crores
7. 31 May-5 June, 1976 Severe Cyclonic Storm Crossed Saurashtra coast near Bhavnagar on 3 June
Maximum wind: Ship HAAKON magnus reported 167 kmph (90 kts)
Loss and Damage: People Killed=70; Cattleheads lost=4,500; Houses Damaged=25,000; Damage estimated to be Rs. 3 crores
8. 13-23 November, 1977 Very Severe Cyclonic Storm* Crossed between Mangalore and Honavar in the early morning of 22 November
Intensity: T 5.5
Loss and Damage: People killed=72; 8,400 houses totally and 19,000 houses partially damaged; Loss estimated to be Rs. 10 crores
9. 4-9 November, 1982 Very Severe Cyclonic Storm* Crossed Saurashtra coast, about 45 km east of Veraval on 8 November
Loss and Damage: People killed=507
Livestock perished=1.5 lakh; Thousands of houses collapsed
10. 17-20 June, 1996 Severe Cyclonic Storm Crossed south Gujarat coast between Veraval and Diu in the early morning of 19 June
Intensity: T 3.5
Maximum wind: Veraval recorded 86 kmph (46 kts) at 0430 hrs IST of 19 June
Storm surge: 5 – 6 m near Bharuch
Loss and Damage: People killed=47 Cattleheads perished=2113; no of houses damaged=29,595; loss of Property=Rs. 1805 lakhs
11. 4-10 June, 1998 Very Severe Cyclonic Storm* Crossed Gujarat coast near Porbandar between 0630 and 0730 hrs IST of 9 June
Intensity: T 5.0
Maximum Wind: Jamnagar recorded 182 kmph (98 kts) at 0730 hrs IST of 9 June
Surge Height: 2-3 m above the astronomical tide of 3.2 m;
Loss and Damage: People killed=1173; People missing=1774
Loss of property worth to be Rs. 1865.38 crore
* Severe Cyclonic Strom with core of hurricane winds as per earlier categorization

Cyclones & their Impact in India

Cyclones & their Impact in India
1. History of Cyclones in India:
1.2. Although cyclones affect the entire coast of India, the East Coast is more prone compared to the West Coast. An analysis of the frequencies of cyclones on the East and West coasts of India during 1891-2000 show that nearly 308 cyclones (out of which 103 were severe) affected the East Coast. During the same period 48 tropical cyclones crossed the West Coast, of which 24 were severe cyclonic storms. Out of the cyclones that develop in the Bay of Bengal, over 58 percent approach and cross the east coast in October and November. Only 25 percent of the cyclones that develop over the Arabian Sea approach the west coast. In the pre-monsoon season, corresponding figures are 25 percent over the Arabian Sea and 30 percent over the Bay of Bengal.
1.3. An account of the cyclones crossing the Indian coast and the details of damage caused by some severe tropical cyclones in India are given below:
Number of Cyclones Crossing Various coastal Districts of East and West Coast of India during 1891- 2000
WEST COAST EAST COAST
State Station Coastal Districts
No. of Cyclonic storms State Station Coastal Districts No. of Cyclonic storms
Kerala
(3)
Malappuram
Kozikode
Kannur
1
1
1


W.Bengal
(69)

Orissa
(98)


Andhra Pradesh
(79)
24 - Parganas
(North & South)
Midnapur

Balasore
Cuttack
Puri
Ganjam
Srikakulam Visakhapatnam
East Godavari
West Godavari
Krishna
Guntur
Prakasam
Nellore
35

34


32
32
19
15

14
9
8
5
15
5
7
16
Karnataka
(2)

Maharastra
(13)

Goa
(2)
Dakshina Kannada
Uttar Kannada
Sindhu durg
Ratnagiri
Mumbai
Thane
Goa
1
1
3
3
3
4
2
Gujarat
(28)
Surat
kaira
Bhavnagar
Amroli
Junngarh
Jamnagar
Kutch
1
1
4
4
7
6
5
Tamilnadu
(62)
Chennai
Cuddalore
Puducherry
Southarcot
Tanjavur
Pudukkottai
Ramnathpuram
Tirunelveli
Kanyakumari
18
7
8
5
12
5
3
2
2

  • Historical records of 11 most devastating cyclones which formed in the Arabian Sea and made landfall on the West coast of India 

  • Historical records of 12 most devastating cyclones, which formed in the Bay of Bengal and made landfall on the East coast of India  

2. Recent Cyclone in Orissa in October 1999: 2.1. A very severe cyclonic storm and a Super Cyclone hit the Orissa coast in quick succession in October 1999. Before the people could recover from the impact of the first cyclone on 17th October, 1999, a Super Cyclone struck Orissa coast during October 29-30, 1999. These cyclones left a trail of death and destruction and devastated 14 districts in the State. About 8960 persons lost their lives, 4,50,000 cattle perished, about 2 million houses were damaged, about 90 million trees were uprooted and 1.8 million ha. paddy and 33,000 ha. non-paddy cultivated land was affected. Infrastructure facilities were severely damaged. Saline inundation left most of the drinking water sources polluted and dysfunctional. The loss estimated by Orissa Government was about Rs. 62 billion, which did not include the loss to the Central Government properties like Railways, Telecommunication etc. According to other estimates, the total financial loss was over Rs. 100 billion making it the worst cyclone related disaster of rare occurrence in the recent past in India.
3. Special nature of the problem 3.1. Though the frequency of Tropical Cyclones in the North Indian Ocean (NIO) are the least in the world (7% of the global total), their impact on the coasts bordering the North Bay of Bengal (North of 150 N latitude) in India as well as in the Bangladesh are extremely disastrous. The problem can be fathomed from the fact that during the past two and a half centuries, 20 out of 23 major cyclone disasters (with human loss of life 10,000 or more and not considering the damages) in the world have occurred over the Indian Subcontinent (India and Bangladesh). One of the major reasons for this is the serious storm tide problem in these coasts. A tropical cyclone of specific intensity when it strikes the east coast of India and Bangladesh, usually produces a higher storm surge compared to that when such a cyclone strikes elsewhere in the world. This is because of the special nature of the coastline, the shallow coastal ocean topography and the characteristics of tide in the North Bay of Bengal region. Further the high density of population, low awareness of the community about cyclones and their risks, inadequate response and preparedness add to the severity of the problem.
3.2. There are 13 Coastal States and UTs in the country, with about 84 coastal districts affected by tropical cyclones. Four States (Tamil Nadu, Andhra Pradesh, Orissa and West Bengal) and one UT (Puducherry) on the East Coast and one State (Gujarat) on the West Coast are the States that are more vulnerable to cyclone disasters.
4. Vulnerability to Cyclones: 4.1. Cyclones are natural events, which can neither be wished away nor prevented. What actually makes these hazards turn in to disasters is the vulnerability of the people and their means of livelihood and the fragility of infrastructure. The Indian Sub-continent is the worst affected part in the world as far as loss of lives is concerned though more severe cyclones do occur in other parts of the world and financial losses are much more elsewhere. This could primarily be attributed to the special nature of the problem discussed above and the vulnerability of the people. High population density, comparatively better employment opportunities and economic compulsions force people to occupy, areas, which are susceptible to cyclones, saline ingress and flooding. Inadequacy of infrastructure adds to their vulnerability. Traditional coping mechanisms have been the mainstay for these people to counter hazards, but during major disasters these coping mechanisms are found wanting. Though communities have a natural tendency to face hazards by joining hands, they usually fail to generate the desired synergy because of unsystematic and ad hoc approaches. On many occasions people are not even aware of the risks involved. The frequent disasters nullify the development of several years and turn the clock back for these vulnerable families.
5. Impact on the Coastal Eco-System: 5.1. “Coastal ecosystem” includes estuaries and coastal waters and lands located at the lower end of drainage basins, where streams and river systems meet the sea and are mixed by tides. The coastal ecosystem includes saline, brackish (mixed saline and fresh) and fresh waters, as well as coastlines and the adjacent lands. All these water and landforms interact as integrated ecological units. Shore-lands, dunes, sandbars, offshore islands, headlands, and freshwater wetlands within estuarine drainages are included in the definition since these interrelated features are crucial to coastal fish and wildlife and their habitats. Mangroves are located all along estuarine areas, deltas, tidal creeks, mud flats, salt marshes and extend over 4871 sq. km (about 7% of world’s mangrove areas). Impact of global warming- induced sea level rise due to thermal expansion is more pronounced in the Bay of Bengal due to the shallowness of the waters. The entire coastal ecosystem in general and the eastern coast in particular are highly vulnerable due to flat and low terrain, high population density, over exploitation of natural resources, high rate of environmental degradation on account of pollution and non-sustainable development. On many occasions, the livelihood requirements of people are detrimental to maintaining the delicate balance of the fragile coastal ecosystem. Degradation of the eco-system not only affects the environment adversely, but also makes the people living in the coastal areas more vulnerable.
Disclaimer

DISASTER MANAGEMENT DEPARTMENT Government of Andhra Pradesh

DISASTER MANAGEMENT DEPARTMENT
Government of Andhra Pradesh

 Vulnerability of the state

Andhra Pradesh is exposed to cyclones, storm surges, floods and droughts. A moderate to severe intensity cyclone can be expected to make landfall every two to three years. About 44 percent of the state is vulnerable to tropical storms and related hazards.
In India, the cyclones develop in the pre-monsoon (April to May) and post-monsoon seasons (October to December), but most of them tend to form in the month of November.
Cyclones on the east coast originate in the Bay of Bengal, the Andaman Sea or the South China Sea, and usually reach the coastline of Tamil Nadu, Andhra Pradesh, Orissa and West Bengal, which are the most vulnerable to these types of hazards. Two of the deadliest cyclones of this century, with fatalities of about 10,000 people in each case, took place in Orissa and Andhra Pradesh during October 1971 and November 1977 respectively. The super cyclone of Orissa in 1999 caused large scale damage to life and property.
Along the Andhra coast, the section between Nizampatnam and Machilipatnam is the most prone to storm surges. Vulnerability to storm surges is not uniform along Indian coasts. The following segments of the east coast of India are most vulnerable to high surges
1.     North Orissa, and West Bengal coasts.
2.     Andhra Pradesh coast between Ongole and Machilipatnam.
3.     Tamil Nadu coast, south of Nagapatnam.

The states bordering the Arabian Sea on the west coast are not completely safe either, as Kerala, Gujarat - and to a lesser extent Maharashtra - are also prone to cyclones. With a frequency of four cyclones per year, one of which usually becomes severe, the Bay of Bengal accounts for seven percent of the annual tropical cyclone activity worldwide.
Despite this relatively low percentage, the level of human and property loss that cyclones cause around the Bay is very high. Once the cyclones enter the mainland, they give way to heavy rains which often translate into floods, as it was the case with the damaging cyclone-induced floods in the Godavari delta, in August of 1986.
Many drought prone areas adjacent to coastal districts in eastern maritime states are thus vulnerable to flash floods originated by the torrential rains induced by the cyclonic depression. In addition to cyclones and its related hazards, monsoon depressions over the north and central areas of the Bay of Bengal move until reaching north and central India, including portions of Andhra Pradesh, bringing heavy to very heavy rains and causing floods in the inland rivers between June and September.
In Andhra traditionally, the flood problem had been confined to the flooding of smaller rivers. But the drainage problem in the coastal delta zones has worsened, multiplying the destructive potential of cyclones and increasing flood hazards. A critical factor is maintenance of irrigation systems. On several occasions, deaths have been caused by breaches in tanks and canals as well as over-flooding caused by silting and growth of weeds.
Effect of Repeated Disasters
The regular occurrence of Disasters both Natural and Man made in Coastal Andhra Pradesh in India has had a series of repercussions on the state country’s Economy, its development policies and political equilibrium and daily life of millions of Indians.
Andhra Pradesh is battered by every kind of natural disaster: cyclones, floods, earthquakes and drought. The coastal region suffers repeated cyclones and floods. The 1977 cyclone and tidal wave, which resulted in great loss of life, attracted the attention of the central and state Governments of India and the international donor communities, as did those of 1979, 1990 and 1996. The floods in the Godavari and Krishna Rivers caused havoc in the East and West Godavari and Krishna districts.
Earthquakes in the recent past have occurred along and off the Andhra Pradesh coast and in regions in the Godavari river valley. Mild tremors have also hit the capital city of Hyderabad, for example in September 2000.
Social and economic life of AP's population is characterized by recurring natural disasters. The state is exposed to cyclones, storm surges, floods, and droughts. According to the available disaster inventories, AP is the state that has suffered the most from the adverse effects of severe cyclones. It has been estimated that about 44 percent of AP's total territory is vulnerable to tropical storms and related hazards, while its coastal belt is likely to be the most vulnerable region in India to these natural phenomena. Khamman district, in the Telengana region, is affected by monsoon floods, along with five districts in Coastal AP. Four districts in Rayalaseema and five in Telengana experience drought. Along the coastline, the section between Nizampatnam and Machilipatnam is the most prone to storm surges. The fertile Delta areas of the Godavari and the Krishna rivers, which contribute substantially to the state's economic prosperity, face flood and drainage problems, and more so in the aftermath of cyclones.
More than sixty cyclones have affected AP this century. The incidence of cyclones seems to have increased in the past decades, to the extent that severe cyclones have become a common event occurring every two to three years, repeatedly and severely affecting the state's economy while challenging its financial and institutional resources3. Almost2 9 million people are vulnerable to cyclones and their effects in Coastal AP, 3.3 million of who belong to communities located within five km of the seashore. The deadliest cyclone in the last twenty years took place in November 1977 killing about 10,000 people. More recently, the May 1990 cyclone, with a death toll close to 1,000 people, caused about US$1.25 billion in damage in ten districts, including the entire coast. Between 1977 and 1992, about 13,000 lives and 338,000 cattle were lost due to cyclones and floods, and nearly 3.3 million houses damaged.
May cyclones are relatively rare in the region, and only about 13 have affected AP in this month this century. However, when they badly hit the Delta areas, as it happened in 1979 in the Krishna district - where 80 percent of the casualties occurred - the population in danger may be higher than usual. May is rice harvesting season, and a good number of itinerant laborers come to the delta from less fertile areas of AP in search of work. Since they lack awareness of the area's most prevalent hazards, this migrant population is more vulnerable than the permanent delta residents. Similarly, entire families have come to the delta districts to engage in activities related to shrimp farming, which has taken off recently in the area. They are involved in the collection of fingerlings, living for several months a year in makeshift shelters along the marshes. The warnings may not reach them on time, and even when they do, their inexperience renders them highly vulnerable.
The Godavari and the Krishna rivers have well-defined stable courses, and their natural and man-made banks have usually been capable of carrying flood discharges, with the exception of their delta areas. Traditionally, the flood problem in AP had been confined o the spilling of smaller rivers and the submersion of marginal areas surrounding Kolleru Lake. However, the drainage problem in the delta zones of the coastal districts has worsened, thereby multiplying the destructive potential of cyclones and increasing flood hazards. Moreover, when a storm surge develops, as it was the case during the severe November 1977, May 1990 and November 1996 cyclones, threats to humans and property multiply as the sea water may inundate coastal areas which are already being subjected to torrential rains. Finally, a critical additional factor affecting the flood management and the irrigation systems is the lack of maintenance. On several occasions, such as the May 1979 cyclone, most of the deaths were occasioned by breaches to the chains of tanks and canals, and over-flooding due in part to the choking of drains by silting and growth of weeds.
Sl.No Year of Cyclone/Heavy Rains Period of Cyclone/Heavy rains Event No.of districts affected Population affected    (in lakhs) Human deaths Live-stock loss Houses damaged Crop area damaged            ( hects) Estimated Loss     (Rs.in Cr.)
1 Nov-77 28th Oct-1 Nov'1977 Severe Cyclonic Storm 8 34 10000 250000 1014800 1351000 172.00
    15-20 Nov' 1977 Severe Cyclonic Storm with core of hurricane              
2 Aug-78 Aug-78   16 0.49 52 1465 22000 951000 150.00
3 May-79 15-13th May '1979 Heavy Rains /Floods Severe Cyclonic Storm with core of hurricane winds 10 37.4 706   748000   242.65
    24-25 Nov'1979 Cyclonic Storm              
4 Oct-80 16-18 Oct'1980 Severe Cyclonic Storm with core of hurricane              
5 Oct-82 16-18 Oct'1982 Cyclonic Storm              
6 Aug-83 Aug-83 Heavy Rains /Floods 8 1.58 58 1726 94218 714000 89.56
7 Oct-83 3-5th Oct'1983 Cyclonic Storm              
8 Nov-84 11-15th Nov'1984 Severe Cyclonic Storm with core of hurricane winds 3 19 7 3976 8244 192000 55.53
9 Oct-85 10-11 Oct,1985 Cyclonic Storm              
10 Dec-85 11-13 Dec'1985 Severe Cyclonic Storm 11 11.75 16 4 3196 214000 40.50
11 Aug-86 Aug-86 Heavy Rains/Floods 13 21.15 309 22000 423000 853200 1686.74
12 Oct-87 15-16th Oct'1987 Cyclonic Storm              
13 Nov-87 2-3 Nov'1987 Severe Cyclonic Storm 10 32.04 119   110550 961000 126.48
    12-13 Nov' 1987 Severe Cyclonic Storm              
14 Jul-88 Jul-88 Heavy Rains /Floods 11 23.43 88 4233 48694 406000 245.40
15 Jul-89 Jul-89 Heavy Rains /Floods 22 89.44 232 10905 227000 593000 913.50
16 Nov-89 3-6 Nov' 1989 Cyclonic Storm              
    5-8 Nov'1989 Severe Cyclonic Storm with core of hurricane winds              
17 May-90 5-10 May'1990 Severe Cyclonic Storm with core of hurricane winds 14 77.81 817 27625 1439659 563000 2137.27
18 Aug-90 Aug-90 Heavy Rains/Floods 10 12.45 50   76420 173000 179.86
19 Oct&Nov-1991 11-15 Nov'1991 Cyclonic Storm 9 0.18 192   97470 409000 367.32
20 Oct/Nov&Dec-1993 Oct/Nov &Dec1993 Cyclonic Storm 5         37000 70.87
21 July/Aug/Sep-1994 July/Aug/sep-1994 Heavy Rains /Floods 6 2.81 12     52000 130.45
22 Oct&Nov-1994 29-31 Oct'1994 Severe Cyclonic Storm 7 2.86 3   79172 452000 625.93
23 May-95 May-95 Severe Cyclonic Storm  with core of hurricane winds 10 2.56 26 3260 43179 320000 471.86
24 Oct&Nov -1995 6th-18th Oct,9-10th Nov 95 Heavy Rains /Floods 19 2.3 229 3663 146525 665000 917.00
25 Jun-96 12-16 June'1996 Cyclonic Storm 10 0.22 100 1607 21517 15000 129.10
26 Aug&Sep-96 Aug & Sep 96 Heavy Rains /Floods 13 0.21 140 188 12100 134000 159.00
27 Oct(1-3)1996 Oct(1-3) 1996 Heavy Rains /Floods 14 0.27 61 154 18058 449000 262.53
28 Oct(17-21)1996 Oct(17-21) 1996 Heavy Rains /Floods 11 87.37 338 146621 130731 1128000 843.27
29 Nov 1996 (6-7th) Nov1996 (6-7th) Severe Cyclonic Storm with core of hurricane winds 4 80.62 1077 19856 616553 511000 6129.25
30 Dec-96 28 Nov-7 Dec'1996 Severe Cyclonic Storm with core of hurricane winds 3 0.37 27 293 7569 21000 53.59
31 Sep-97 23-26th Sep'1997 Severe Cyclonic Storm 6 9.47 40 93 7725 135000 255.87
32 Sep-Oct 1998 Sep-Oct 1998 Heavy Rains /Floods 22 16.34 260 5126 150196 1405000 2525.20
33 Nov-98 13-15th Nov'1998 Very Severe Cyclone Storm 5 0.68 16 5874 13543 339000 305.99
34 Oct-99 16-17th Oct 1999 Cyclonic Storm 1 1.89 3 388 3425   237.76
35  Aug'2000 22-31st Aug'2000* Heavyrains / Floods 17 1.98364 207 6156 99800 178000 966.15
36 Oct-01 15-17th Oct-2001 Heavy Rains / Flash Floods 5   119   111340    
37  Dec-2003 15-16th Dec-2003 Cyclonic Storm / Flash Floods 6 42.68 44 102324 17147 265741 765.92
38  Sept-2005 18-19th Sept-2005 Heavy Rains / Flash Floods 10 350 107 14416 118618 551966 2697.97
39 Aug-06 2-5th August-2006 Cyclone Storm / Floods 10 13.84 165 20530 276567 219897 3455.23
40 Sep-06 14-22ne Sept-2006 Heavy Rains 8 0.23 52 4849 29837 219950 188.44
41 Oct-Nov-06 28-4th Nov-2006 Ogni Cyclone 5 13.85 41 350000 95218 384550 7173.25
42 Jun-07 21st Jun to 24th Jun07 Heavy Rains 16 8.35 50 47172 195456 51587 1296.2
43 Sep-07 17th to 22nd sept2007 Heavy Rains/Floods 15 2.4 77 745 33241 62000  
44 Oct-07 5th to 7th Oct-2007 Heavy Rains/Floods 6 0.94 9 3126 9246 16405 1156.11
45 Oct-Nov-07 29th oct to 1st Nov-07 Heavy Rains/Floods 4 27.32 36 0 611907 23000  
46 Feb-08 9th to 13th Feb- 2008 Heavy Rains/Floods 11 0.13 4 3000 122 292854 741.47
47 Mar-08 22nd to 29th March-08 Unseasonal Heavy Rains and Consequent Floods  22 0.014 36 1643 3556 227507 929.88
48 Aug-08 3rd to 11th Aug-08 Heavy Rains/ Floods 15 44.28 130 6692 44364 196038 1116
49 Nov-08 14th to 16th Nov-08 Khaimuk - Cyclone 9 1.0 0 37 1190 59287 36
50 Nov-08 25th to 30th Nov-08 Nisha - Cyclone 5 1.0 9 28 8258 220000 80
51 Sept-Oct-09 29th Sept to 4th Oct.2009 Floods due to unprecedented Rains 13 20.72 90 49686 259095 226092 12455.75
52 May-10 17th to 22nd May 2010 Laila - Cyclone 14 17.80 22 2075 14298 26685.83 1603.22
53 June- Sept,2010 Southwest Monsoon  Heavy Rains/ Floods 22 8.95 65 7236 11022 277000 5776.60
54 Oct-Nov,2010 29th Oct to 8th Nov-2010 Heavy Rains/ Floods/JAL Cyclone 13 16.98 63 1140 20554 483000 2496.98
55 Dec,2010 5th Dec to 8th Dec-2010 Heavy Rains/ Floods 15 8.16 21 3026 3169 1208000 2739.33