Monday 31 July 2023

Labourers Covered Under Social Security Schemes


Labourers Covered Under Social Security Schemes

Posted On: 31 JUL 2023 5:36PM by PIB Delhi

As per the Unorganised Workers’ Social Security Act, 2008, the Government is mandated to provide Social Security to the workers of unorganized sector by formulating suitable welfare schemes on matters relating to life and disability cover, health and maternity benefits, old age protection etc. The details of the social security schemes are follow:

       Life and Disability cover is provided through Pradhan Mantri Jeevan Jyoti Bima Yojana (PMJJBY) and Pradhan Mantri Suraksha Bima Yojana (PMSBY). Risk coverage under  PMJJBY  scheme is for Rs. 2.00 Lakh in case of death of insured, due to any reason, at annual premium of Rs. 436/-. The PMSBY is also available to the people in the age group of 18 to 70 years with a bank/post office account. The risk coverage under the scheme is for Rs. 2.00 Lakh in case of accidental death or total permanent disability and Rs. 1.00 lakh for partial permanent disability due to accident at a premium of Rs. 20/- per annum. As on 28.06.2023 total 16,92,48,279 and 36,17,75,732 beneficiaries have been enrolled in the country under PMJJBY and PMSBY respectively. In Karnataka the number of beneficiaries under PMJJBY and PMSBY are 75,43,970 and 1,61,70,795 respectively.

The health and maternity benefits are insured through Ayushman Bharat- Pradhan Mantri Jan Arogya Yojana (AB-PMJAY) under deprivation and occupation criteria. It provides health insurance coverage upto Rs. 5.00 lakhs per family for secondary and tertiary care related hospitalization. As on 25.07.2023 approx. 24.19 Crore beneficiaries have been verified and Ayushman Cards Created in the country and in Karnataka the number is 1,41,20,609.

In order to provide old age protection, the Government of India launched Pradhan Mantri Shram Yogi Maan-Dhan (PM-SYM) pension yojana in 2019. It provides monthly minimum assured pension of Rs. 3000/- after attaining the age of 60 years. The workers in the age group of 18-40 years whose monthly income is Rs. 15000/- or less can join the PM-SYM Scheme. Under this scheme 50% monthly contribution is payable by the beneficiary and equal matching contribution is paid by the Central Government. As on 25.07.2023, total  49,47,212 beneficiaries have been enrolled in the country and the number of beneficiaries is 1,30,527 in the State of Karnataka.

Apart from above, other schemes such as Public Distribution System through One Nation One Ration Card scheme under National Food Security Act, Mahatama Gandhi National Rural Employment Guarantee Act, Deen Dayal Upadhyay Gramin Kausal Yojana, Pradhan Mantri Awas Yojana, Pradhan Mantri Gareeb Kalyan Rojgar Yojana, Mahatma Gandhi Bunkar Bima Yojana, Deen Dayal Antyodaya Yojana, PMSVANidhi, Pradhan Mantri Kaushal Vikas Yojana etc. are also available for the unorganized sector workers including labourers depending upon their eligibility criteria.

Ministry of Labour & Employment has also launched eShram portal on 26.08.2021, to create a National Database of the Unorganized Workers. It consists of name, occupation, address, educational qualification, skill types, family details etc. As on 25.07.2023 approx. 28.97 crore unorganized workers have been identified and registered on eShram Portal.

This information was given by Union Minister of State for Labour and Employment Shri. Rameshwar Teli in a written reply in the Lok Sabha today.

                                                          ***

National Forest Policy


National Forest Policy

Posted On: 31 JUL 2023 5:41PM by PIB Delhi

Forest Survey of India (FSI), Dehradun, an organization under the Ministry carries out the assessment of forest cover biennially, since 1987 and the findings are published in India State of Forest Report (ISFR). The total forest and tree cover of the country as per ISFR 2021 assessment is 8,09,537 square kilometer which is 24.62% of the geographical area of the country. The total forest and tree cover has increased by 2261 square kilometer as compared to the ISFR 2019 assessment.

The Ministry provides technical and financial assistance to States/UTs under various Centrally Sponsored Schemes namely Green India Mission (GIM), Forest Fire Prevention and Management Scheme, CAMPA, Nagar Van Yojana and other schemes of line ministries to increase the forest and tree cover of the country as per the mandate of National Forest Policy.

Green India Mission (GIM) activities were started in the Financial Year 2015-16. During the last five years, the amount of Rs. 755.28 Crores has been released to seventeen States and one union territory for taking up the afforestation activities.

The Ministry has also implemented Centrally Sponsored Scheme, National Afforestation programme for regeneration of degraded forest and adjoining areas in the country. Under the scheme, an amount of Rs. 108.57 crore has been released during the years 2019-20 to 2021-22. National Afforestation Programme is now stands merged with Green India Mission.

The Ministry is implementing Nagar Van Yojana (NVY) since the year 2020 which envisages creation of 600 Nagar Vans and 400 Nagar Vatika in the country during the period 2020-21 to 2024-25 under the funds available under Compensatory Afforestation Fund (CAMPA). The Nagar Van Yojana aims to enhance the green cover in the urban and peri-urban areas including biological diversity, provide ecological benefits and improve the quality of life of city dwellers. So far, the Ministry has approved 270 projects under Nagar Van Yojana with the total cost of Rs.238.64 Crore.

The Compensatory Afforestation Fund (CAMPA fund) is being utilized by States/UTs for taking up compensatory afforestation as per approved Annual Plan of Operations for compensating the loss of forest & tree cover due to diversion of forest land for developmental projects as per provisions of Compensatory Afforestation Fund Act, 2016 (CAF Act) and CAF Rules, 2018. During the last five years, an amount of Rs. 55,394.16 Crore has been released to State/UT Forest Department under CAMPA funds.

Afforestation activities are also taken up under various programmes and schemes of line Ministry such as Mahatma Gandhi National Rural Employment Guarantee Scheme, National Bamboo Mission, Sub-Mission on Agroforestry etc. and under schemes of State Government/UT Administration through different departments, Non-Government Organizations, Civil Society, Corporate bodies etc. The multi departmental efforts have yielded good results in conserving and enhancing forest cover in the country.

Ministry has formulated draft National Forest Policy after wide consultations with various stakeholders, including inter-ministerial consultations and placed in public domain in 2018. The draft Policy recommends to integrate climate change mitigation and adaptation measures in forest management including resilience to climate change by forest dependent communities.

This information was given by Union Minister of State for Environment, Forest and Climate Change Shri Ashwini Kumar Choubey in a written reply in the Lok Sabha today.


Green India Mission


Green India Mission

Posted On: 31 JUL 2023 5:43PM by PIB Delhi

National Mission for a Green India (GIM) is one of the eight Missions under the National Action Plan on Climate Change. The target under the Mission is 10 m ha on forest and non-forest lands for increasing the forest/tree cover and to improve the quality of existing forest. Based on the perspective plans submitted by the States and as per the availability of funds, so far seventeen States namely Andhra Pradesh, Arunachal Pradesh, Chhattisgarh, Haryana, Himachal Pradesh, Karnataka Kerala, Madhya Pradesh, Maharashtra, Manipur, Mizoram, Odisha, Punjab, Sikkim, Uttarakhand, West Bengal, Uttar Pradesh and one union territory Jammu & Kashmir have been taken up under GIM.

The States are considered for funding under GIM after evaluation of their perspective plan and Annual plan of operations prepared in accordance with the guidelines of GIM. The state of Telangana has not submitted their Perspective Plan and Annual Plan of Operations under GIM so far and therefore no funds have been allocated to the State under GIM. The Development Monitoring and Evaluation Office (DMEO), NITI Aayog, Government of India, has conducted the Evaluation of National Mission for a Green India in 2020-21 on aspects such as Relevance, Effectiveness, Efficiency, Sustainability, Impacts and Equity within the scheme and has further recommended the continuation of scheme.​

This information was given by Union Minister of State for Environment, Forest and      Climate Change Shri Ashwini Kumar Choubey in a written reply in the Lok Sabha today.

Delhi records its lowest daily average AQI in the current year on 29th July with a recorded AQI of 59;


Delhi records lowest average Air Quality Index (AQI) for 7-month period January to July in 2023 compared to the corresponding period for the last 04 years starting from 2019 (except 2020 - the year of lockdown due to covid)


The average AQI of Delhi for this 07-month period was 182.6 in 2023, 209 in 2022, 204.7 in 2021, 159 in 2020 and 215.3 in 2019;

Delhi records its lowest daily average AQI in the current year on 29th July with a recorded AQI of 59;

During July of 2023, Delhi experienced all 31 days with 'Good to Moderate' air quality days;

The 31 days period of July in 2023 has also witnessed reduction in daily average PM2.5 and PM10 concentrations;

Daily average PM2.5 concentration in Delhi for July, 2023 stood at 35µg/m3 as against 36 in 2022, 40 in 2021, 34 in 2020 and 47 in 2019;

Posted On: 31 JUL 2023 6:26PM by PIB Delhi

Delhi records its lowest average Air Quality Index (AQI) during the July of 2023 compared to the corresponding period of last 04 years from 2019.  During July of current year, Delhi experienced all 31 days with 'Good to Moderate' Air Quality Index (AQI).

The number of ‘Good to Moderate’ Air Quality Days for the 31 days period (July) was 26 in the year 2019; 31 in 2020; 29 in 2021; 31 in 2022; and 31 in the current year 2023.

The monthly average AQI for Delhi during this period also remained in ‘Satisfactory’ AQI category i.e., 83.71. Delhi has recorded its lowest monthly average AQI during July of current year compared to the corresponding period for the last 04 years from 2019 and monthly average AQI of July, 2023 is comparable with the monthly average AQI of July, 2020.

The chart below depicts the Monthly Average AQI for the month of July during the 05 years period (2019-2023):

During 31 days period of July of current year, Delhi has witnessed the lowest levels of daily average PM10 and PM2.5 concentration, as compared to the corresponding period for last 04 years i.e. from 2019 onwards and is comparable to the average PM10 and PM2.5 concentration of July, 2020.

A chart depicting PM10 and PM2.5 running average (µg/m3) for the 31 days period of July during the 05 years (2019-2023) is given below:


CAQM urges GNCTD, NCR State Governments, DPCC and SPCBs, regulatory bodies, industries, RWAs, civil society organizations and citizens to further contribute towards clean air to reduce integrated exposure and protect public health.

The Commission reaffirms its commitment to monitor enforcement of laws, rules, regulations and standards by enforcement and implementing agencies as well as support initiatives that foster public awareness about the significance of clean air. CAQM is working closely with various stakeholders concerned to take effective measures for prevention, control and abatement of air pollution and to improve the overall air quality in the National Capital Region.

Sunday 30 July 2023

HIGH vs. LOW: What are the impacts of weather pressures?


WEST MONROE, La. (KTVE/KARD)– From determining what to wear to how much rain is needed to grow crops for food. Different air pressures can help indicate certain weather conditions. A high pressure system and a low pressure system usually have their own recognizable weather associated with them.

The two most common units in the United States to measure pressure are Inches of Mercury and Millibars. Inches of mercury refers to the height a column of mercury measured in hundredth of inches. While a millibar is 1/1000th of a bar and is the amount of force is takes to move an object weighing a gram, one centimeter, in one second. Lower pressure will have values less than 1013 millibars and significant low pressure will be 990 millibars. However, values around 1013 millibars and higher indicate influence from a high pressure system and can possibly go as high as 1030 millibars.

When a high pressure system is viewed from above, winds spiral outward of the center in a clockwise rotation in the Northern Hemisphere. A high pressure system is also associated with sinking air, when air sinks from high in the atmosphere to the lower levels it tends warm up and dry out. Depending on how strong the high pressure system it can cause the environment to be stable. Due to that fact the air at the top of the atmosphere is less dense. The kind of conditions that a high pressure system is associated with is sunny skies and calm weather which is represented with a blue capital H.

While low pressure is the opposite, when viewed from above the winds spiral into a low pressure center in a counter-clockwise rotation in the Northern hemisphere. With a low pressure system the air is rising up in the atmosphere, and depending how strong the low pressure system is, it can causes the environment to be unstable. Within the lifting of air it mean that less pressure is exerted on the ground which is why the air pressure is low. The rising of air causes the water vapor in the air condense and form clouds and rain. The kind of weather associated with low pressure are storms and strong winds and it is represented by a red capital L.


Atmosphere


Atmosphere (वातावरण) means Layer of vapour & gases (atmos-vapor &sphere-layer of gas) that may surround a material body of sufficient mass, and that is held in place by the gravity of the body. An atmosphere may be retained for a longer duration, if the gravity is high and the atmosphere’s temperature is low. Some planets consist mainly of various gases, but only their outer layer is their atmosphere. Earth’s atmosphere, which contains  oxygen used by most organisms  for respiration and carbon dioxide used by plants,  algae and cyanobacteria  for  photosynthesis , also protects living organisms from genetic damage by solar  ultraviolet radiation.

The atmospheric composition on Earth is largely governed by the by-products of the very life that it sustains. Earth’s atmosphere contains 78.08% nitrogen, 20.95% oxygen, a variable amount water vapor, 0.93% argon, 0.038% carbon dioxide, and traces of hydrogen, helium, and other “noble” gases.

The Earth’s atmosphere consists, from the ground up, of the  Troposphere (which includes the planetary boundary layer as lowest layer) Stratosphere (which includes the ozone layer), Mesosphere, Thermosphere (which contains the ionosphere), Exosphere. Each of the layers has a different temperature range with height.

The atmosphere of Earth is a layer of gases surrounding the planet Earth that is retained by Earth’s gravity. The atmosphere protects life on Earth by absorbing ultraviolet solar radiation, warming the surface through heat retention (greenhouse effect), and reducing temperature extremes between day and night

Air is the name given to atmosphere used in breathing  and  photosynthesis. Air is mainly composed of nitrogen, oxygen, and argon, which together constitute the major gases of the atmosphere.. Many natural substances may be present in tiny amounts in an unfiltered air sample, including dust, pollen and spores, sea spray, and volcanic ash. Various industrial pollutants also may be present, such as chlorine (elementary or in compounds), fluorine compounds, elemental mercury, and sulfur compounds such as sulfur dioxide [SO2].

In general, air pressure and density decrease in the atmosphere as height increases. Earth’s atmosphere can be divided into five main layers. From highest to lowest, these layers are:

1)Troposphere:-The troposphere begins at the surface and extends to between 9 km (30,000 ft) at the poles and 17 km (56,000 ft) at the equator(विषुववृत्त), with some variation due to weather. The troposphere is mostly heated by transfer of energy from the surface, so on average the lowest part of the troposphere is warmest and temperature decreases with altitude(उंची).

2)Stratosphere:-The stratosphere extends from the tropopause to about 51 km. Temperature increases with height due to increased absorption of ultraviolet radiation by the ozone layer. While the temperature may be −60 °C (−76 °F; 210 K) at the tropopause, the top of the stratosphere is much warmer, and may be near freezingThe stratopause, which is the boundary between the stratosphere and mesosphere, typically is at 50 to 55 km

3)Mesosphere:-The mesosphere extends from the stratopause to 80–85 km . It is the layer where most meteors burn up upon entering the atmosphere. Temperature decreases with height in the mesosphere. The mesopause, the temperature minimum that marks the top of the mesosphere, is the coldest place on Earth and has an average temperature around −85 °C (−120 °F; 190 K). At the mesopause, temperatures may drop to −100 °C (−150 °F; 170 K). Due to the cold temperature of the mesosphere, water vapor is frozen, forming ice clouds . A type of lightning referred to as either sprites or ELVES, form many miles above thunderclouds in the troposphere.

4)Thermosphere:-Temperature increases with height in the thermosphere from the mesopause up to the thermopause, then is constant with height. Unlike in the stratosphere, where the inversion is caused by absorption of radiation by ozone, in the thermosphere the inversion is a result of the extremely low density of molecules. The temperature of this layer can rise to 1,500 °C (2,700 °F), though the gas molecules are so far apart that temperature in the usual sense is not well defined. The point dividing these two regions is known as the turbopause. The top of the thermosphere is the bottom of the exosphere, called the exobase.

5)Exosphere:-The outermost layer of Earth’s atmosphere. It is mainly composed of hydrogen and helium. The particles are so far apart that they can travel hundreds of kilometers without colliding with one another.


What percentage of the earth's water is tied up in the atmosphere (clouds)?

 About 2.0x10^13 tonnes of water is in the atmosphere, out of a total of 1.4x10^18 tonnes in the hydrosphere. That would be .0014%.

The mantle (lithosphere) contains about as much water as the hydrosphere, so counting that it would be .0007%.


Types of Clouds


Types of Clouds

Q.1. Is fog a type of cloud?

Ans. Yes, fog is a type of cloud that touches the ground.

Q.2. What are the types of rain clouds?

Ans. Stratus, Cirrus, Cumulus, Stratocumulus, Nimbostratus, and Cirrostratus.

Q.3. Thunderstorms form from what type of cloud?

Ans. Thunderstorms arise from the Cumulonimbus or thunderstorm cloud.

Q.4. Which are the rarest types of clouds?

Ans. Lenticularis, Nacreous, Asperitas, Kelvin-Helmholtz wave, Supercell storm cloud, Mackerel sky, Mammatus, Virga, and Fallstreak holes.

Q.5. A mackerel sky describes what type of clouds?

Ans. A mackerel sky describes Altocumulus clouds as they look similar to the scales of mackerel fish.

We often feel amazed looking at the sky and how it changes patterns over day and night. This happens due to the formation of clouds that we see above us. Clouds are collections of tiny droplets of water or ice crystals that are found suspended in the atmosphere.

There are different types of clouds based on the height where they are found and the characteristics they show. If you have noticed, the pattern of clouds in higher altitudes is different from that found near the sea-level. Also, clouds differ from one another based on seasons. Sometimes these differences help us predict a change in weather conditions. They also help to drive the water cycle in nature.  

How Many Different Types of Cloud are There and What are They

The present Latin-based international system for classifying clouds was introduced way back in 1803 by meteorologist Luc Howard. It was then adapted by the World Meteorological Organization (WMO) in their International Cloud Atlas that recognizes ten basic clouds ‘genera’; based on the height it forms in the sky and their appearance.

The ten basic cloud types are — 1. Cirrus (Ci), 2. Cirrostratus (Cs), 3. Cirrocumulus (Cc), 4.Altocumulus (Ac), 5. Altostratus (As), 6. Nimbostratus (Ns), 7.Cumulus (Cu), 8. Stratus (St), 9. Stratocumulus (Sc), and 10. Cumulonimbus (Cb).  

Types of Clouds

How Do the Main Types of Clouds Form and What Do They Mean

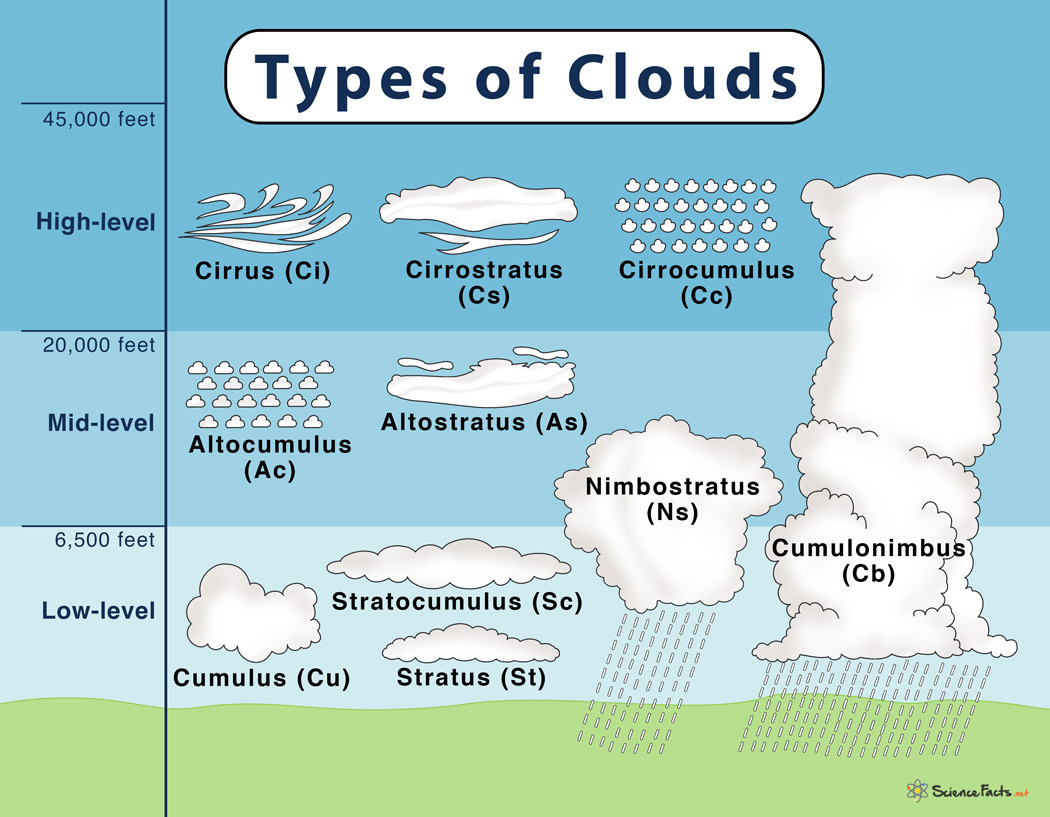
Among the ten basic cloud types, nine are grouped into three levels based on the height they are found in the sky. Accordingly, clouds are named as high-level, middle-level, and low-level clouds. The remaining one cloud type is multi-level.

Given below are the characteristic features of each of the cloud types based on which they are identified:

High-level Clouds (Over 20,000 Feet)

These are the topmost clouds that are typically thin and white in appearance but can give other colors when the sun is low on the horizon during sunrise or sunset. High-level clouds are of three types:

1. Cirrus (Ci)

Cirrus are white, delicate, and feathery clouds that streak across the sky and are made of ice crystals. Their transparent nature depends on the separation of ice crystals due to wind currents.

These clouds occur in fair weather but can also be found ahead of large-scale storms like tropical cyclones and nor’easters.Cirrus are found before sunrise and after sunset appearing as bright yellow or red in color. During the daytime, they appear yellowish near the horizon, and after sunset becomes grayish. These clouds appear long before other clouds, and fade out much later as well.

What kind of weather they are associated with: A change in weather can be expected soon.

2. Cirrostratus (Cs)

Cirrostratus are transparent, whitish clouds with a hair-like appearance covering nearly the entire sky like the veil. They can be identified by seeing a halo (a circle or a ring of light) around the sun or moon.

Cirrostratus clouds are commonly seen in winters as there is much moisture in the upper atmosphere during that period. These clouds are also sometimes associated with approaching warm fronts.

What kind of weather they are associated with: Rain or snowfall

3. Cirrocumulus (Cc)

Cirrocumulus are small, white patches of clouds that look like regularly arranged grains or ripples. Cirrocumulus represents the degraded state of cirrus and cirrostratus and will show some characteristics of both of them.

These rare clouds are found in winter seasons when the atmosphere is bright and full of sunshine.

What kind of weather they are associated with: Fair but cold weather conditions. They may also indicate approaching a hurricane in tropical regions.

Mid-level Clouds (6,500-20,000 feet)

They are found below the high-level clouds and are mainly composed of water droplets. Mid-level clouds are also found to contain ice crystals when the temperature is low. Mid-level clouds are of three types:

1. Altocumulus (Ac)

Altocumulus are the most common mid-level clouds that can be identified by white or grey round patches covering the entire sky with parallel bands. These clouds are made of liquid water but often do not produce rain. Altocumulus are also known as ‘sheep backs’ and ‘mackerel skies’ because they look similar to the wool of sheep or scales of mackerel fish.  

They are found during the hot and humid summer mornings.  

What kind of weather they are associated with: They can indicate thunderstorms to come later in the day and are also seen ahead of cold fronts indicating the onset of winter.

2. Altostratus (As)

Altostratus are gray or blue-gray clouds that cover the entire sky partially or totally. Altostratus clouds are made of ice crystals and water droplets that are thin enough to allow sun rays to pass through them dimly but cannot form shadows in the ground.

These clouds form ahead of a warm or occluded front. Altostratus can also occur along with Cumulus during cold fronts.

What kind of weather they are associated with: Get prepared for a continuous spell of snowfall or rain.

3. Nimbostratus (Ns)

Nimbostratus are dark, grey clouds that cover the entire sky. They are diffused by falling rain snow and are thick enough to block sunlight.

These clouds are typical rain clouds seen during overcast conditions when steady rain or snow is falling or are about to fall.

What kind of weather they are associated with: Expect darkness with continuous rain or snowfall.

Low-level Clouds (less than 6,500 feet)

They are found closest to the earth’s surface and are composed of water droplets. Low-level clouds are mainly of three types:

1. Cumulus (Cu)

Cumulus are the symbol of clouds we use to draw and study during our childhood. They look like fluffy, white cotton balls in the background of a clear, blue sky. Cumulus clouds look beautiful during sunset and can be of varying shapes and sizes.

These clouds are formed on clear, sunny days when the sun rays reach and heat the earth’s surface. They are thus commonly called ‘fair weather’ clouds. Cumulus are observed during late morning hours and disappear by the evening.

2. Stratus (St)

Stratus are thin, flat, grayish sheets of clouds that cover the whole sky. Stratus seldom produces heavy rain because of their delicate nature but can appear as fog in mountain or hilly regions.  

Stratus clouds are found during gloomy, overcast days.

What kind of weather they are associated with: Expect darkness with a slight drizzle.

3. Stratocumulus (Sc)

They are low, puffy, whitish or grayish clouds that occur in patches with blue sky between them. When observed from below, they often resemble a honeycomb appearance. Stratocumulus can be imagined if we think of cutting and spreading cumulus clouds unevenly across the sky.

Stratocumulus clouds are found mostly on cloudy days when there is a weak air current in the atmosphere. 

What kind of weather they are associated with: Currently, a fair-weather, but a storm may be on its way.

Multi-level Towering Clouds (up to over 45,000 feet)

These are clouds found in low, middle, and sometimes even in high layers and thus are called multi-level clouds.

Cumulonimbus (Cb)

Also known as thunderstorm clouds, they are often being classified as low-level clouds. These clouds are found in all three layers – extending over several miles and often reaching high altitudes. Cumulonimbus looks like cumulus clouds from which they grow and assume towering shapes with bulging upper portions. The upper portion of these clouds is flat, smooth, and fibrous, whereas the lower portion is ragged, hazy, and dark.   

Cumulonimbus clouds grow on hot days when warm, wet air rises high into the sky, resembling a mountain or a tower. 

Newer Types of Clouds

For the first time in more than 30 years, some new cloud types are added to the International Cloud Atlas by WMO. They have features that might somewhat be familiar to the clouds studied so far, while others that might look slightly different. Here is a list of these accessory clouds:

  • Volutus: Commonly known as a ‘roll cloud’ by meteorologists, it is a typically rare, low-level, horizontal, tube-shaped cloud. Volutus are commonly associated with thunderstorms and sometimes with cold-fronts.
  • Asperitas:It is a rare cloud that resembles a stormy ocean wavewhen viewed from underneath. Its appearance is often associated with convective thunderstorms that may occur afterward. However, it can also be found in relatively calm environments.   
  • Fluctus: A relatively short-lived wave formation found on the top surface of this cloud. It forms curls or breaking waves that are usually found to occur with Cirrus, Altocumulus, Stratocumulus, Stratus, and sometimes with Cumulus.
  • Cavum: It is a well-defined cloud that is generally circular when viewed from below but may appear oval-shaped when viewed from a distance. When formed due to an aircraft’s interaction with the cloud, it appears linear, in the form of a dissipating trail. Cavum is found to occur with Altocumulus and Cirrocumulus and rarely with Stratocumulus.
  • Murus: Commonly known as ‘wall cloud’, it is formed as a localized, persistent, and sudden lowering from the base of Cumulonimbus. Murus is often associated with a severe thunderstorm that typically develops in the rain-free portion of the Cumulonimbus.
  • Cauda: Also known as ‘tail cloud’, it is a horizontal, tail-shaped supplementary cloud, found at low levels extending from the main precipitation region of Cumulonimbus to the Murus clouds. It is typically attached to the Murus, where both their bases are  found at the same height. Cauda clouds are uncommon and are usually associated with severe thunderstorms.
  • Flumen: Bands of low clouds associated with a supercell convection storm, Cumulonimbus. They are arranged parallel to the low-level winds and are moving towards the supercell thunderstorm. These accessory clouds are not attached to the wall cloud, and the cloud base is much higher than the wall cloud.,
  • Flammagenitus: They are special cloudsthat originated due to convection initiated by localized forest fires, wildfires, or volcanic eruptions. These clouds must contain water droplets, at least in part. 
  • Homogenitus: These clouds originate from human activities, such as gases arising from thermal power plants.
  • Homomutatus occurs when persistent contrails are found over a long time under the influence of strong winds, allowing them to grow and spread over a larger portion of the sky. These clouds continue undergoing internal transformation and eventually take on the appearance of natural cirri-form clouds.
  • Cataractagenitus: Develops locally in the vicinity of large waterfalls when water breaks into spray by the falls. The motion of locally ascending air compensates the downdraft caused by the water current moving downwards.
  • Silvagenitus: May develop locally over forests due to increased humidity formed by evaporation and transpiration from the trees.