Thursday 31 August 2023

More than 150 Lakh MT fertilizers available in the country – enough to meet the needs of farmers across the country


Dr Mansukh Mandaviya reviews availability and use of fertilizers in India with States/UTs


More than 150 Lakh MT fertilizers available in the country – enough to meet the needs of farmers across the country

Balanced use of fertilizers is needed to save the mother earth and it is our resolve to reduce the use of chemical fertilizers: Dr Mandaviya

States were urged to keep a check on diversion of Urea for non-agriculture purpose and jointly work with the Centre to ensure that urea diversion is dealt strongly

Posted On: 22 AUG 2023 3:37PM by PIB Delhi

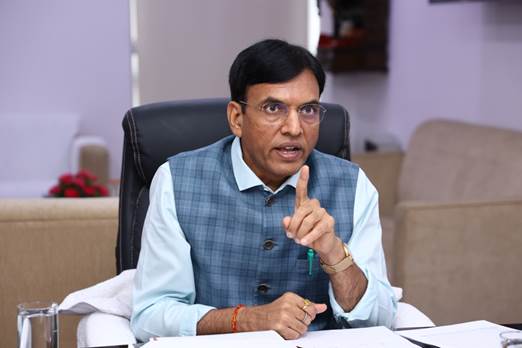
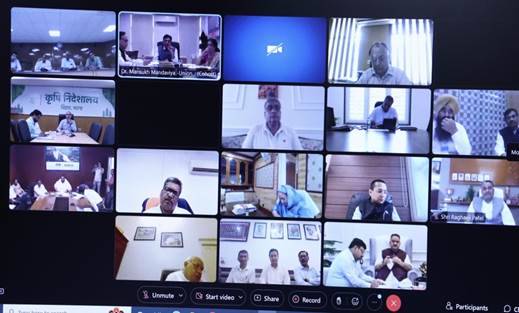
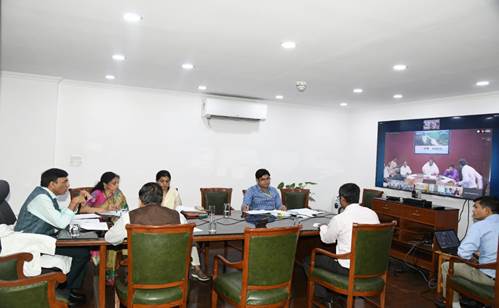
Union Minister of Chemicals and Fertilizers, Health & Family Welfare Dr. Mansukh Mandaviya interacted with State Agriculture Ministers on the availability and use of fertilizers in the country, here today. During the meeting he also reviewed progress of nano urea, nano DAP and promotion of alternate fertilizers at the field level and steps initiated by the States in this regard.

At the outset, Dr. Mandaviya informed all the States that there is adequate availability of fertilizers in the country with the present level of 150 LMT stocks. This stock will not only take care of ongoing Kharif Season but will also ensure comfortable opening for the forthcoming Rabi Season.

Dr Mandaviya highlighted the necessity of reducing the excessive use of chemical fertilizers to save soil. He reiterated that Union Government has already taken a step in the form of PM PRANAM scheme. The efforts also include introduction of slow-release Sulphur Coated Urea (Urea Gold), nano urea, nano DAP etc. to promote use of alternate fertilizers to save the mother earth. The State Government expressed their willingness to be active participants in this resolve.

There was a discussion on the initiative of PMKSKs across the country which are acting as One-Stop-Shop catering to all the needs of farmers at one place. He made an appeal to all the State Agriculture Ministers and State Government Officials to regularly visit these PMKSKs and spread awareness among farmers.

Hon’ble Minister made an earnest appeal to the States/ UTs about the need to keep a check on diversion of agriculture grade urea for non-agricultural purpose. He further asked the States/ UTs to run awareness campaigns, thereby, reducing the possible diversion of Agriculture Urea and to take strict action against the defaulters. It is recalled that based on the Joint Inspections by the Fertilizer Flying Squad of Centre Government and various State Agriculture Departments, State Governments have registered 45 FIRs against defaulting Urea Using Units, cancelled licenses of 32 Mixture Units and de-authorized 79 mixture units along with strict actions under Essential Commodities Act & Prevention of Black Marketing Act. The State Government also echoed the sentiment of Zero Tolerance against such culprits.

The Meeting concluded with Centre and States on board to take all necessary steps forward to promote use of alternate fertilizers, reduce the excessive consumption of Chemical Fertilizers. The recently launched initiatives like PM-PRANAM, Urea Gold, Nano-Urea, Nano-DAP were well recognized by the States with equal resolve to achieve the desired results in the larger interests of the farming community.  

State Agriculture Ministers from various States and senior officers from State Governments  and senior officials of Department of Fertilizers & Department of Agriculture & Farmers Welfare attended the meeting.

Natural Gas - Natural Gas production (weight: 6.88 per cent) increased by 8.9 per cent in July, 2023 over July, 2022. Its cumulative index increased by 2.3 per cent during April to July, 2023-24 over the corresponding period of previous year.


Combined Index of Eight Core Industries increases by 8.0% (provisional) in July 2023 as compared to the Index of July 2022


INDEX OF EIGHT CORE INDUSTRIES (BASE: 2011-12=100) FOR JULY, 2023

Posted On: 31 AUG 2023 5:00PM by PIB Delhi

The combined Index of Eight Core Industries (ICI) increased by 8.0 per cent (provisional) in July 2023 as compared to the Index of July 2022. The production of Coal, Steel, Natural Gas, Cement, Electricity, Refinery Products, Fertilizers and Crude Oil increased in July 2023 over the corresponding month of last year. Details of annual and monthly indices and growth rates are provided at Annex I & II respectively.

ICI measures combined and individual performance of production of eight core industries viz. Coal, Crude Oil, Natural Gas, Refinery Products, Fertilizers, Steel, Cement and Electricity. The Eight Core Industries comprise 40.27 percent of the weight of items included in the Index of Industrial Production (IIP).

Final growth rate of Index of Eight Core Industries for April 2023 is revised to 4.6 per cent from its provisional level 3.5 per cent. The cumulative growth rate of ICI during April to July, 2023-24 reported 6.4 per cent (provisional) as compared to the corresponding period of last year.

The summary of the Index of Eight Core Industries is given below:

Coal - Coal production (weight: 10.33 per cent) increased by 14.9 per cent in July, 2023 over July, 2022. Its cumulative index increased by 10.1 per cent during April to July, 2023-24 over corresponding period of the previous year.


Crude Oil - Crude Oil production (weight: 8.98 per cent) increased by 2.1 per cent in July, 2023 over July, 2022. Its cumulative index declined by 1.0 per cent during April to July, 2023-24 over the corresponding period of previous year.


Natural Gas - Natural Gas production (weight: 6.88 per cent) increased by 8.9 per cent in July, 2023 over July, 2022. Its cumulative index increased by 2.3 per cent during April to July, 2023-24 over the corresponding period of previous year.


Petroleum Refinery Products - Petroleum Refinery production (weight: 28.04 per cent) increased by 3.6 per cent in July, 2023 over July, 2022. Its cumulative index increased by 2.3 per cent during April to July, 2023-24 over the corresponding period of previous year.


Fertilizers - Fertilizer production (weight: 2.63 per cent) increased by 3.3 per cent in July, 2023 over July, 2022. Its cumulative index increased by 9.1 per cent during April to July, 2023-24 over the corresponding period of previous year.


Steel - Steel production (weight: 17.92 per cent) increased by 13.5 per cent in July, 2023 over July, 2022. Its cumulative index increased by 15.3 per cent during April to July, 2023-24 over the corresponding period of previous year.


Cement - Cement production (weight: 5.37 per cent) increased by 7.1 per cent in July, 2023 over July, 2022. Its cumulative index increased by 11.2 per cent during April to July, 2023-24 over the corresponding period of previous year.


Electricity - Electricity generation (weight: 19.85 per cent) increased by 6.9 per cent in July, 2023 over July, 2022. Its cumulative index increased by 2.7 per cent during April to July, 2023-24 over the corresponding period of previous year.


Note 1: Data for May 2023, June 2023 and July, 2023 are provisional. Index numbers of Core Industries are revised/ finalized as per updated data from source agencies.

Note 2: Since April 2014, Electricity generation data from Renewable sources are also included.

Note 3: The industry-wise weights indicated above are individual industry weight derived from IIP and blown up on pro rata basis to a combined weight of ICI equal to 100.

Note 4: Since March 2019, a new steel product called Hot Rolled Pickled and Oiled (HRPO) under the item ‘Cold Rolled (CR) coils’ within the production of finished steel has also been included.

Note 5: Release of the index for August, 2023 will be on Friday 29th September, 2023.


Annex I

Performance of Eight Core Industries

Yearly Index & Growth Rate

Base Year: 2011-12=100

Index

Sector

Coal

Crude Oil

Natural Gas

Refinery Products

Fertilizers

Steel

Cement

Electricity

Overall Index

Weight

10.33

8.98

6.88

28.04

2.63

17.92

5.37

19.85

100.00

2012-13

103.2

99.4

85.6

107.2

96.7

107.9

107.5

104.0

103.8

2013-14

104.2

99.2

74.5

108.6

98.1

115.8

111.5

110.3

106.5

2014-15

112.6

98.4

70.5

108.8

99.4

121.7

118.1

126.6

111.7

2015-16

118.0

97.0

67.2

114.1

106.4

120.2

123.5

133.8

115.1

2016-17

121.8

94.5

66.5

119.7

106.6

133.1

122.0

141.6

120.5

2017-18

124.9

93.7

68.4

125.2

106.6

140.5

129.7

149.2

125.7

2018-19

134.1

89.8

69.0

129.1

107.0

147.7

147.0

156.9

131.2

2019-20

133.6

84.5

65.1

129.4

109.8

152.6

145.7

158.4

131.6

2020-21

131.1

80.1

59.8

114.9

111.6

139.4

130.0

157.6

123.2

  2021-22

142.3

77.9

71.3

125.1

112.4

163.0

156.9

170.1

136.1

  2022-23

163.5

76.6

72.4

131.2

125.1

178.1

170.6

185.2

146.7

Apr-Jul 22-23

146.2

78.1

72.0

133.0

119.0

165.3

167.3

195.1

144.8

Apr-Jul 23-24*

161.0

77.3

73.7

136.1

129.9

190.6

186.0

200.3

154.1

      *Provisional


Growth Rates (on Y-o-Y basis in per cent)

Sector

Coal

Crude Oil

Natural Gas

Refinery Products

Fertilizers

Steel

Cement

Electricity

Overall Growth

Weight

10.33

8.98

6.88

28.04

2.63

17.92

5.37

19.85

100.00

2012-13

3.2

-0.6

-14.4

7.2

-3.3

7.9

7.5

4.0

3.8

2013-14

1.0

-0.2

-12.9

1.4

1.5

7.3

3.7

6.1

2.6

2014-15

8.0

-0.9

-5.3

0.2

1.3

5.1

5.9

14.8

4.9

2015-16

4.8

-1.4

-4.7

4.9

7.0

-1.3

4.6

5.7

3.0

2016-17

3.2

-2.5

-1.0

4.9

0.2

10.7

-1.2

5.8

4.8

2017-18

2.6

-0.9

2.9

4.6

0.03

5.6

6.3

5.3

4.3

2018-19

7.4

-4.1

0.8

3.1

0.3

5.1

13.3

5.2

4.4

2019-20

-0.4

-5.9

-5.6

0.2

2.7

3.4

-0.9

0.9

0.4

2020-21

-1.9

-5.2

-8.2

-11.2

1.7

-8.7

-10.8

-0.5

-6.4

2021-22

8.5

-2.6

19.2

8.9

0.7

16.9

20.8

8.0

10.4

2022-23

14.8

-1.7

1.6

4.8

11.3

9.3

8.7

8.9

7.8

Apr-Jul 22-23

26.6

-0.5

3.5

11.7

11.3

7.0

12.9

13.1

11.5

Apr-Jul 23-24*

10.1

-1.0

2.3

2.3

9.1

15.3

11.2

2.7

6.4

    *Provisional. YoY is calculated over the corresponding financial year of previous year


Annex II

Performance of Eight Core Industries

Monthly Index & Growth Rate

Base Year: 2011-12=100

Index

Sector

Coal

Crude Oil

Natural Gas

Refinery Products

Fertilizers

Steel

Cement

Electricity

Overall Index

Weight

10.33

8.98

6.88

28.04

2.63

17.92

5.37

19.85

100.00

Jul-22

132.7

77.3

72.6

129.8

127.6

166.8

155.4

188.9

141.1

Aug-22

127.5

76.7

73.0

123.6

130.9

170.5

152.0

191.3

139.9

Sep-22

127.5

75.2

72.1

120.2

127.0

172.8

158.7

187.4

138.6

Oct-22

145.8

77.4

73.0

123.5

129.5

177.3

155.2

169.3

138.8

Nov-22

167.5

75.8

71.8

119.7

129.2

175.5

164.3

166.7

139.4

Dec-22

184.4

78.2

74.5

139.3

129.9

190.9

184.8

179.4

153.4

Jan-23

198.6

78.3

75.2

142.0

135.8

199.5

184.7

186.6

158.8

Feb-23

190.1

68.1

67.0

129.1

125.2

185.4

180.2

174.0

147.3

Mar-23

235.5

77.3

74.6

144.7

118.1

204.4

198.4

188.0

164.7

Apr-23

161.2

75.0

68.9

132.7

118.7

191.2

192.0

192.3

151.2

May-23*

167.6

78.8

73.3

141.1

138.2

190.7

190.8

201.6

157.1

Jun-23*

162.4

76.4

73.4

136.2

130.8

191.2

195.0

205.2

155.8

Jul-23*

152.6

78.9

79.0

134.4

131.8

189.4

166.3

202.0

152.4

      *Provisional


Growth Rates (on Y-o-Y basis in per cent)

Sector

Coal

Crude Oil

Natural Gas

Refinery Products

Fertilizers

Steel

Cement

Electricity

Overall Growth

Weight

10.33

8.98

6.88

28.04

2.63

17.92

5.37

19.85

100.00

Jul-22

11.4

-3.8

-0.3

6.2

6.2

7.5

0.7

2.3

4.8

Aug-22

7.7

-3.3

-0.9

7.0

11.9

5.8

2.1

1.4

4.2

Sep-22

12.1

-2.3

-1.7

6.6

11.8

7.7

12.4

11.6

8.3

Oct-22

3.8

-2.2

-4.2

-3.1

5.4

5.8

-4.2

1.2

0.7

Nov-22

12.3

-1.1

-0.7

-9.3

6.4

11.5

29.1

12.7

5.7

Dec-22

12.3

-1.2

2.6

3.7

7.3

12.3

9.5

10.4

8.3

Jan-23

13.6

-1.1

5.2

4.5

17.9

14.3

4.7

12.7

9.7

Feb-23

9.0

-4.9

3.1

3.3

22.2

12.4

7.4

8.2

7.4

Mar-23

11.7

-2.8

2.7

1.5

9.7

12.1

-0.2

-1.6

4.2

Apr-23

9.1

-3.5

-2.9

-1.5

23.5

16.6

12.4

-1.1

4.6

May-23*

7.2

-1.9

-0.3

2.8

9.7

10.9

15.3

0.8

5.0

Jun-23*

9.8

-0.6

3.5

4.6

3.4

20.8

9.9

4.2

8.3

Jul-23*

14.9

2.1

8.9

3.6

3.3

13.5

7.1

6.9

8.0

     *Provisional. YoY is calculated over the corresponding month of previous year