Carbon Dioxide Concentration: GEOS-5 Model
Description
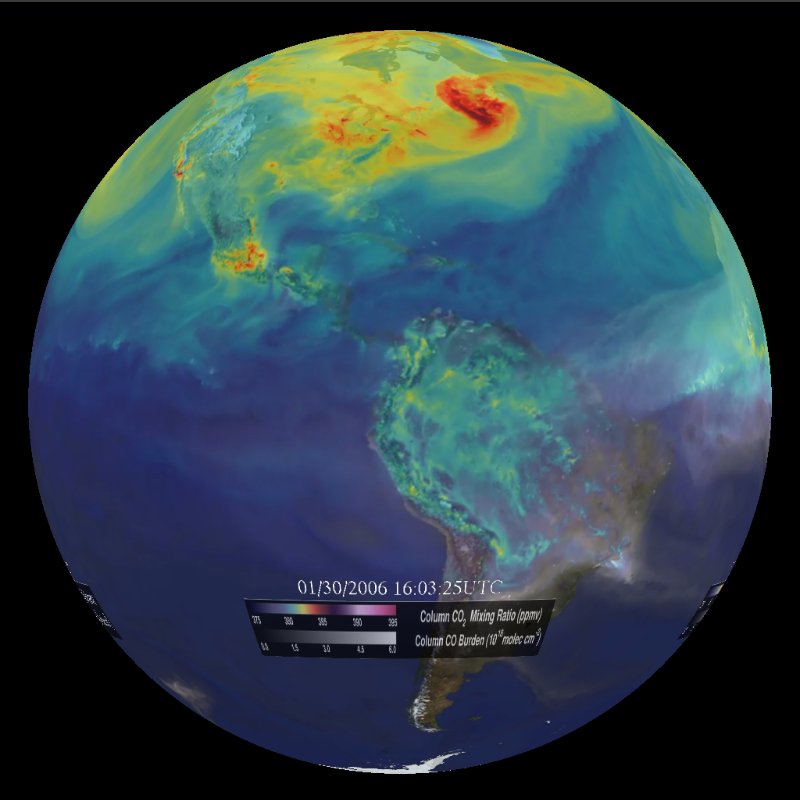
The visualization is a product of a NASA computer model called GEOS-5, created by scientists with the Global Modeling and Assimilation Office at NASA's Goddard Space Flight Center, Greenbelt, Maryland. This particular simulation has about 64 times greater resolution than most global climate models. In particular, the simulation is called a Nature Run. In this kind of simulation, real data on emissions and atmospheric conditions is ingested by the model, which is then left to run on its own to simulate the behavior of Earth's atmosphere for a two-year period - in this case, May 2005 to June 2007.
The colors represent a range of carbon dioxide concentrations, from 375 (dark blue) to 395 (light purple) parts per million. The red represents about 385 parts per million. White plumes represent carbon monoxide emissions.
North American Emissions: One of the visually striking things about this animation is how much local weather patterns affect carbon dioxide in the atmosphere. In this close-up view of North America - from Feb. 1, 2006 to Mar. 1, 2006 in the simulation - you can see the major emissions sources in the U.S. Midwest and along the East Coast. As the carbon dioxide is emitted, westerly winds created by the warm currents of the Gulf Stream carry the greenhouse gas eastward over the Atlantic Ocean.
Asia and the Himalayas: In this view of Asia, two things stand out: the major emissions sources of the industrialized Asian countries, and the natural barrier of the Himalayas. As carbon dioxide concentrations swirl and move eastward, the Himalayas - the crescent-shaped mountain range just north of India - redirect winds. This video shows Feb. 1, 2006 to Mar. 1, 2006 from the simulation.
African fires: While the previous movies showed regions of major man-made emissions, this close-up shows the emission of carbon dioxide - and carbon monoxide, the plumes of white - from fires in southern Africa. This video shows Aug. 1, 2006 to Sept. 1, 2006, a period of seasonal burning in this region.
Notable Features
- In North America, notice how weather patterns affect carbon dioxide distribution in the atmosphere. Emissions in the U.S. Midwest and East Coast are carried east by the westerly winds to the Atlantic Ocean.
- In Asia, major emissions in industrialized Asian countries are apparent and move eastward.
- In Africa, plumes of white, carbon monoxide emissions, are seen from fires.
No comments:
Post a Comment