WONDERFUL DISCUSSION WITH SHRI JKP SIR UNDER KSS
Air humidity can be estimated by measuring
Air humidity can be estimated by measuring
- dry bulb temperature, and
- wet bulb temperature
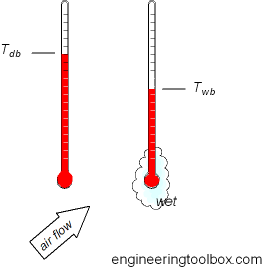
Dry Bulb Temperature - Tdb - can be measured with a simple thermometer as shown above.
Wet Bulb Temperature - Twb - can be measured with a standard thermometer with some wet clothing, cotton or similar, around the bulb. Note that continuously air flow around the thermometer is important to evaporate water from the wet clothing and achieve a correct wet bulb temperature.
Sufficient air movement can be achieved with a sling thermometer or similar.
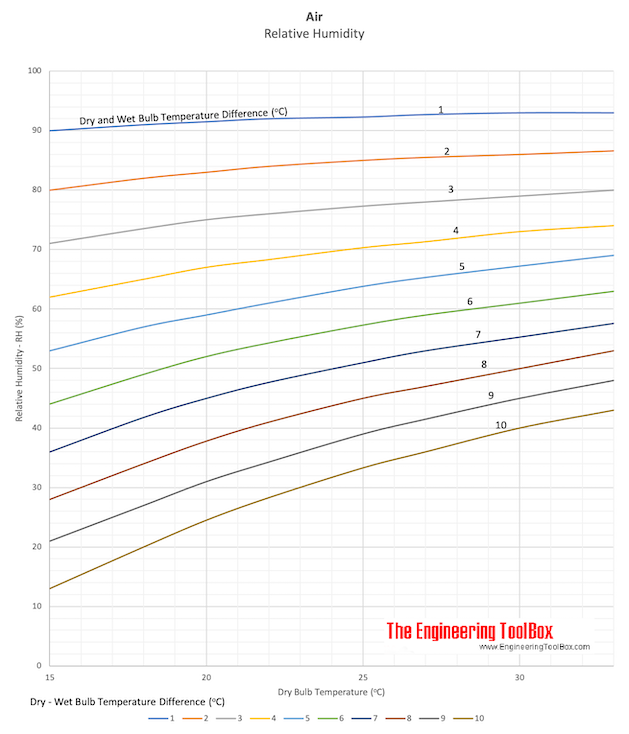
Relative humidity can be estimated from the tables below or alternatively from a psyhrometric or a Mollier diagram.
Example - The State of Air in the Mollier Diagram
If the dry bulb temperature of air is 19oC and the web bulb temperature is 12oC - then the state of air can be visualized in the Mollier diagram as indicated below.
- the relative humidity is approximately 42%
- the humidity ratio is approximately 0.0057 kgh2o/kgdry_air
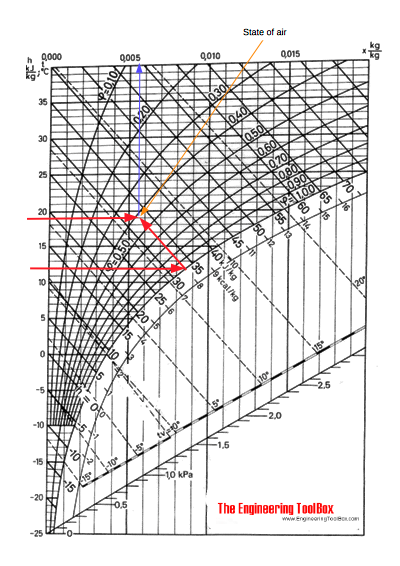
Relative Humidity - Temperature in Celsius
The table below can be used to estimate the relative humidity of air if dry and wet bulb temperatures are known.
| Relative Humidity - RH (%) | ||||||||
|---|---|---|---|---|---|---|---|---|
| Tdb - Twb (oC) | Dry Bulb Temperature - Tdb (oC) | |||||||
| 15 | 18 | 20 | 22 | 25 | 27 | 30 | 33 | |
| 1 | 90 | 91 | 91 | 92 | 92 | 92 | 93 | 93 |
| 2 | 80 | 82 | 83 | 84 | 85 | 85 | 86 | 87 |
| 3 | 71 | 73 | 75 | 76 | 77 | 78 | 79 | 80 |
| 4 | 62 | 65 | 67 | 68 | 70 | 71 | 73 | 74 |
| 5 | 53 | 57 | 59 | 61 | 64 | 65 | 67 | 69 |
| 6 | 44 | 49 | 52 | 54 | 57 | 59 | 61 | 63 |
| 7 | 36 | 42 | 45 | 47 | 51 | 53 | 55 | 58 |
| 8 | 28 | 34 | 38 | 41 | 45 | 47 | 50 | 53 |
| 9 | 21 | 27 | 31 | 34 | 39 | 41 | 45 | 48 |
| 10 | 13 | 20 | 25 | 28 | 33 | 36 | 40 | 43 |
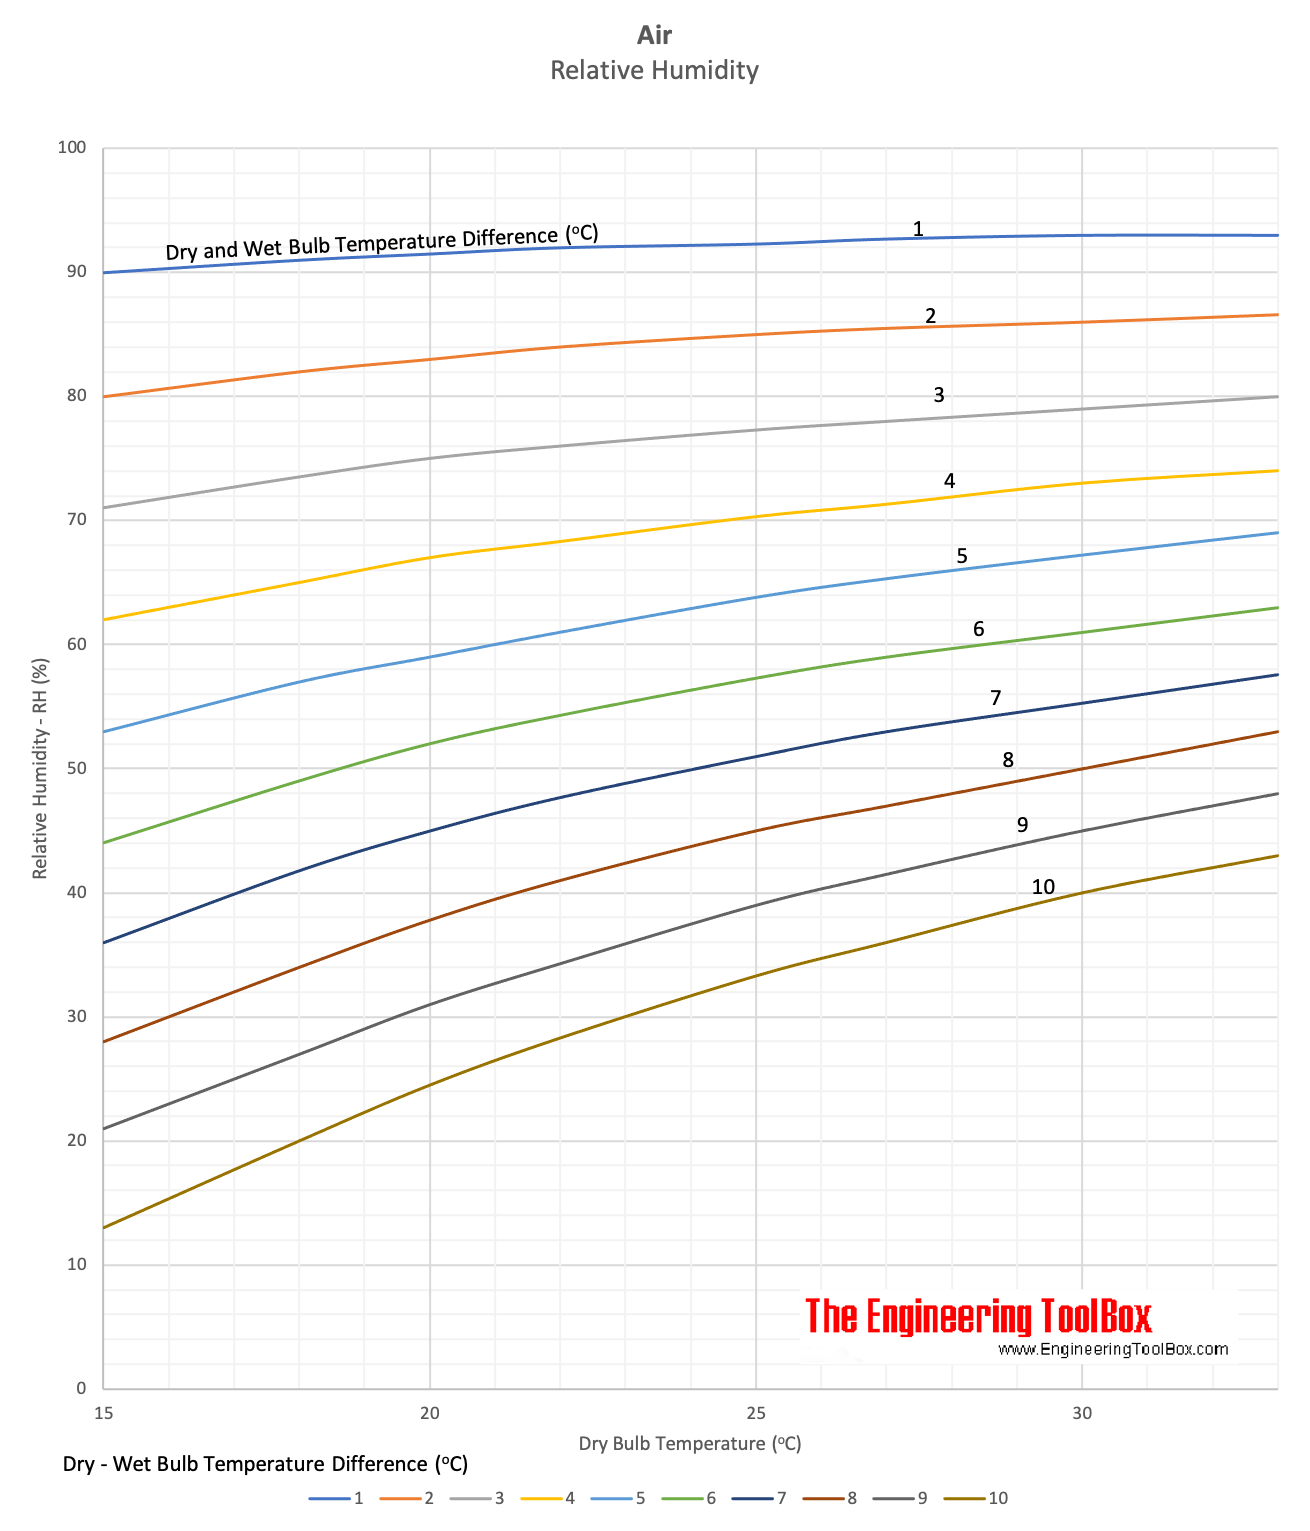
Example - Relative Humidity
If the dry bulb temperature of air is 18oC and the web bulb temperature is 12oC - then the difference between them is 6oC. By using the table above
- the relative humidity is approximately 49%
Example - the State of Air in the Psychrometric Chart
The state of air with dry bulb temperature 75oF and wet bulb temperature 62.5oF can be visualized in thepsychrometric chart as indicated below.
- the relative humidity is approximately 50%
- the humidity ratio is approximately 65 grainsh2o/lbdry_air
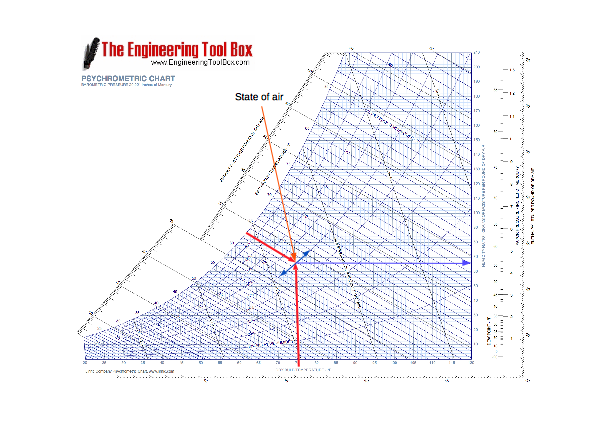
Relative Humidity - Temperature in Fahrenheit
The table below can be used to estimate the relative humidity of air if dry and wet bulb temperatures are known.
| Relative Humidity - RH (%) | ||||||||
|---|---|---|---|---|---|---|---|---|
| Tdb - Twb (oF) | Dry Bulb Temperature - Tdb (oF) | |||||||
| 60 | 64 | 68 | 72 | 76 | 80 | 84 | 88 | |
| 1 | 94 | 95 | 95 | 95 | 96 | 96 | 96 | 96 |
| 2 | 90 | 90 | 90 | 91 | 91 | 92 | 92 | 92 |
| 3 | 84 | 85 | 85 | 86 | 87 | 88 | 88 | 89 |
| 4 | 78 | 80 | 81 | 82 | 83 | 84 | 84 | 85 |
| 5 | 73 | 75 | 76 | 78 | 79 | 80 | 80 | 81 |
| 6 | 68 | 70 | 72 | 73 | 75 | 76 | 77 | 78 |
| 7 | 63 | 66 | 67 | 69 | 71 | 72 | 73 | 74 |
| 8 | 58 | 61 | 63 | 65 | 67 | 68 | 70 | 71 |
| 9 | 54 | 57 | 59 | 61 | 63 | 65 | 66 | 68 |
| 10 | 49 | 52 | 55 | 57 | 59 | 61 | 63 | 64 |
No comments:
Post a Comment