Bits and Pieces of Information
When I come across information related to water and wastewater topics, information that I'm not yet prepared to comment on in detail, I post it here. Some of this information I post because I know I will need to come back to it when I'm at a wastewater plant doing work. My hope is that the various charts, tables, and graphics will ultimately have some value to a wide range of readers. Take a look and see for yourself.
Hydrogen Sulfide and Sulfur Compounds
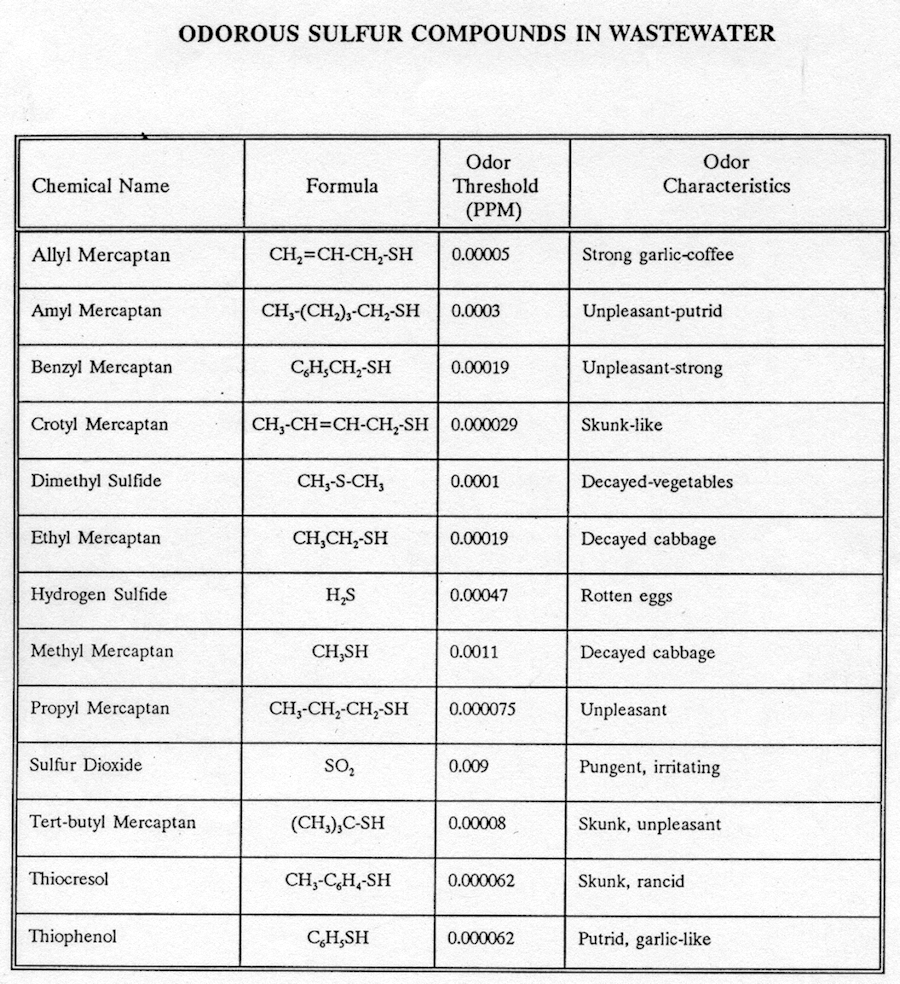
I do a lot of work associated with oxidizing reduced sulfur compounds. This often involves the addition of hydrogen peroxide to a waste stream to react with hydrogen sulfide. The reaction is interesting in terms of how pH affects the species of sulfur in the wastewater which then impacts dosing requirements. Shown here are a collection of graphics related to the oxidation of sulfur.

Hydrogen peroxide can be used to oxidize hydrogen sulfide and other reduced sulfur compounds. The hydrogen peroxide dosage rate is a function of not only the hydrogen sulfide concentration but also the pH of the waste stream. You can see the effect of pH in the graphic below.


BTEX Solubility
BTEX: Benzene, Toluene, Ethylbenzene, and Xylene. These are aromatic chemical compounds found in the wastewater of refineries and chemical plants. These compounds are of concern because they can be toxic to microorganisms in a biological treatment system and they can easily be volatilized and become an airborne pollutant.

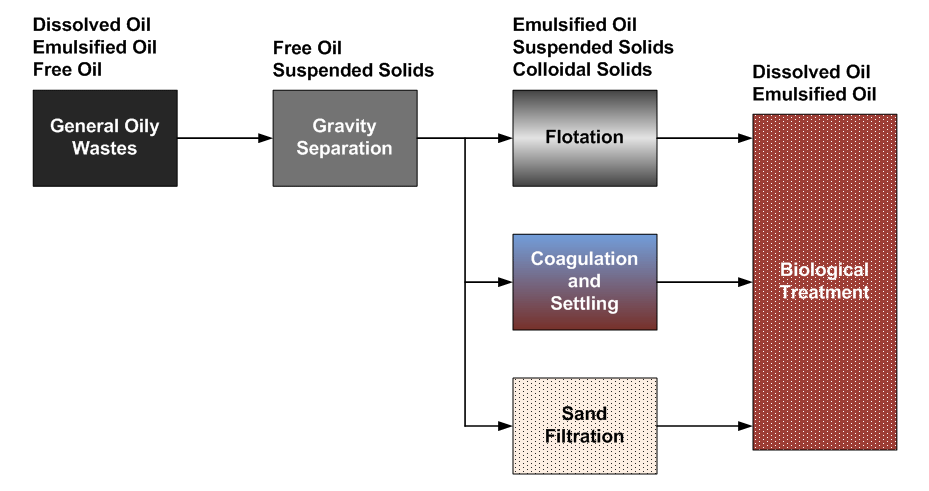
Oily Wastewater
Click on the graphic below to obtain a 1-page, full-size, high-quality drawing as a PDF file.
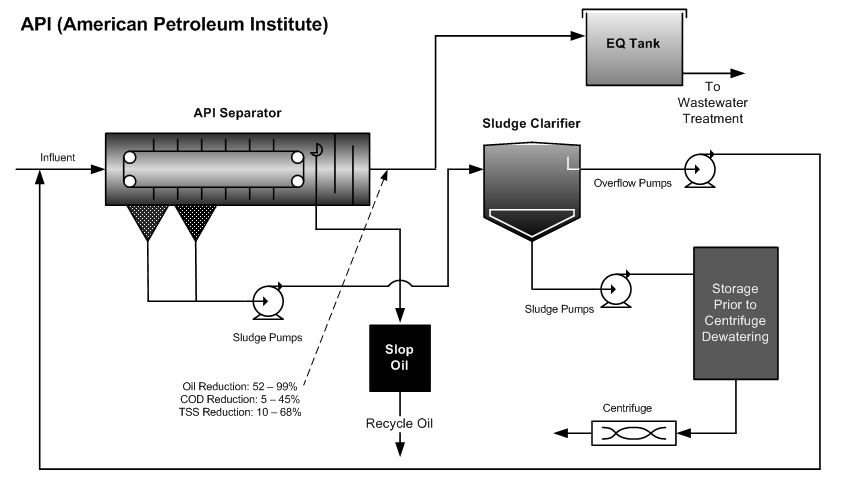
API Separator
Click on the graphic below to obtain a 1-page, full-size, high-quality drawing as a PDF file.
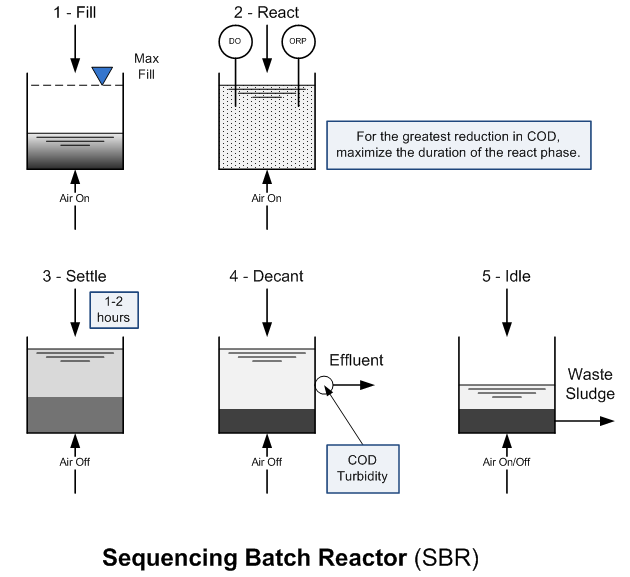
Sequencing Batch Reactor (SBR)
This simple graphic shows the five steps required to operate an SBR. Click on the graphic below to obtain a 1-page, full-size, high-quality drawing as a PDF file.


Inflow and Infiltration Explained Graphically


Reverse Osmosis Membrane

Water Cycle
Click on the graphic below to obtain a 1-page, full-size, high-quality drawing as a PDF file.


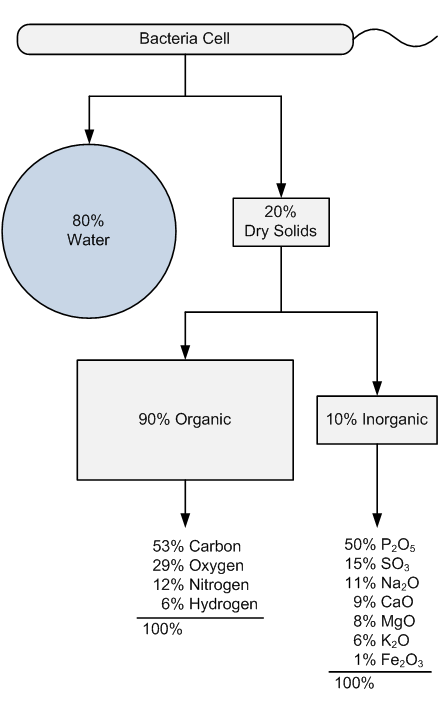
Composition of a Bacteria Cell
Click on the graphic below to obtain a 1-page, full-size, high-quality drawing as a PDF file.

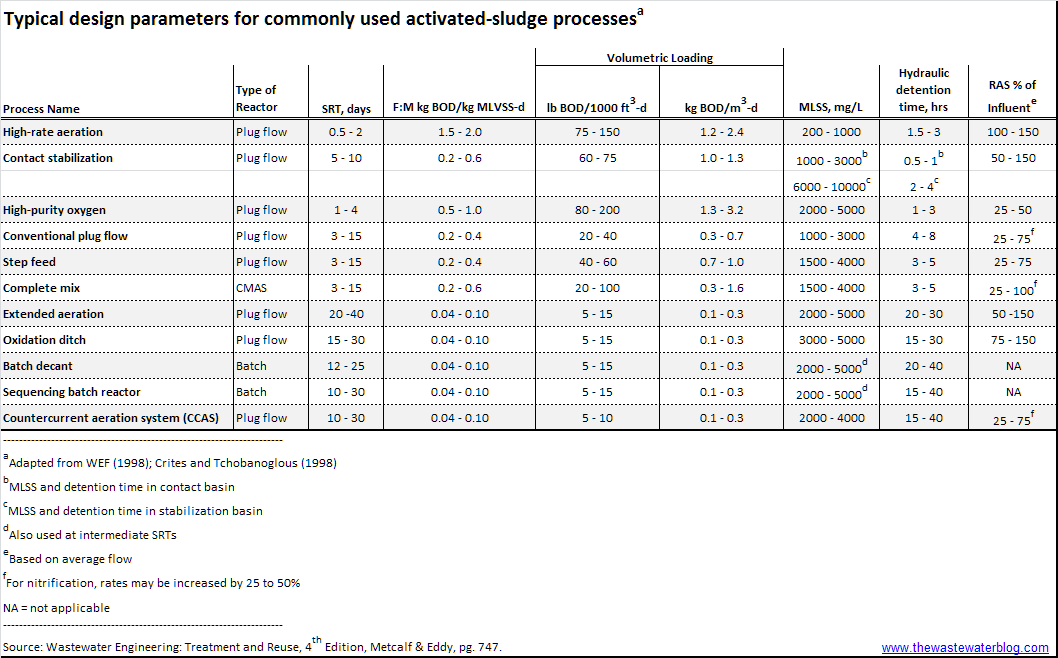
Metcalf & Eddy Activated Sludge Design Parameters
The table below can be a little hard to read. If you click on the table you will open a PDF version for easier viewing and printing.

Composition of Seawater

No comments:
Post a Comment