Climate Change is real for this Blogger – more coastal flooding in Norfolk
Hi. I’m Larry Atkinson and I live in Norfolk, Virginia. I, like many people living in coastal areas, am personally experiencing the effects of climate change. The ocean is rising and there are many days when I have to figure out which road to take to work at Old Dominion University’s Climate Change and Sea Level Rise Initiative. These are not just any roads but Federal highways that almost 100,000 personnel who work at the Norfolk Naval Base must also use. So for us climate change is now a matter of adapting to it. We can’t talk about preventing it: it is too late for that. Minor street flooding that used to occur 10’s of hours per year 50 years ago now occurs 50 to 100 hours per year or more. It may be called ‘minor’ but driving through salt water is not good!
I’ve been studying the ocean for over 50 years and before that I was a commercial salmon fisherman during my high school and college years in Bellingham, Washington. I’ve spent months on the ocean off the east and west coasts of the US, off Chile, Japan, Spain and on long ocean research campaigns in the North and South Atlantic Ocean, the Pacific, and the Antarctic. I’ve studies methane in the ocean, gas exchange, Gulf Stream and Kuroshio Current dynamics, effects of cold air outbreaks off the SE US, aquaculture in Spain, effects of oil and gas exploration, offshore wind energy, and more that I’ve forgotten. And now I’m studying sea level rise with colleagues and more importantly studying how we figure out how fast the ocean is rising and how we can adapt to it. And that is what this blog will focus on.
These data are from Norfolk but the same story holds for just about any low lying coastal area.
Because of the very low topography of these coastal areas a small rise in sea level results in more hours of some area experiencing flooding.
The first figure we show the hours per year that sea level is 1 and 2 feet above mean higher high water (MHHW) at Sewells Point NOAA water level gauge. We use this as a ‘proxy’ for water levels in a several mile area surrounding the gauge.
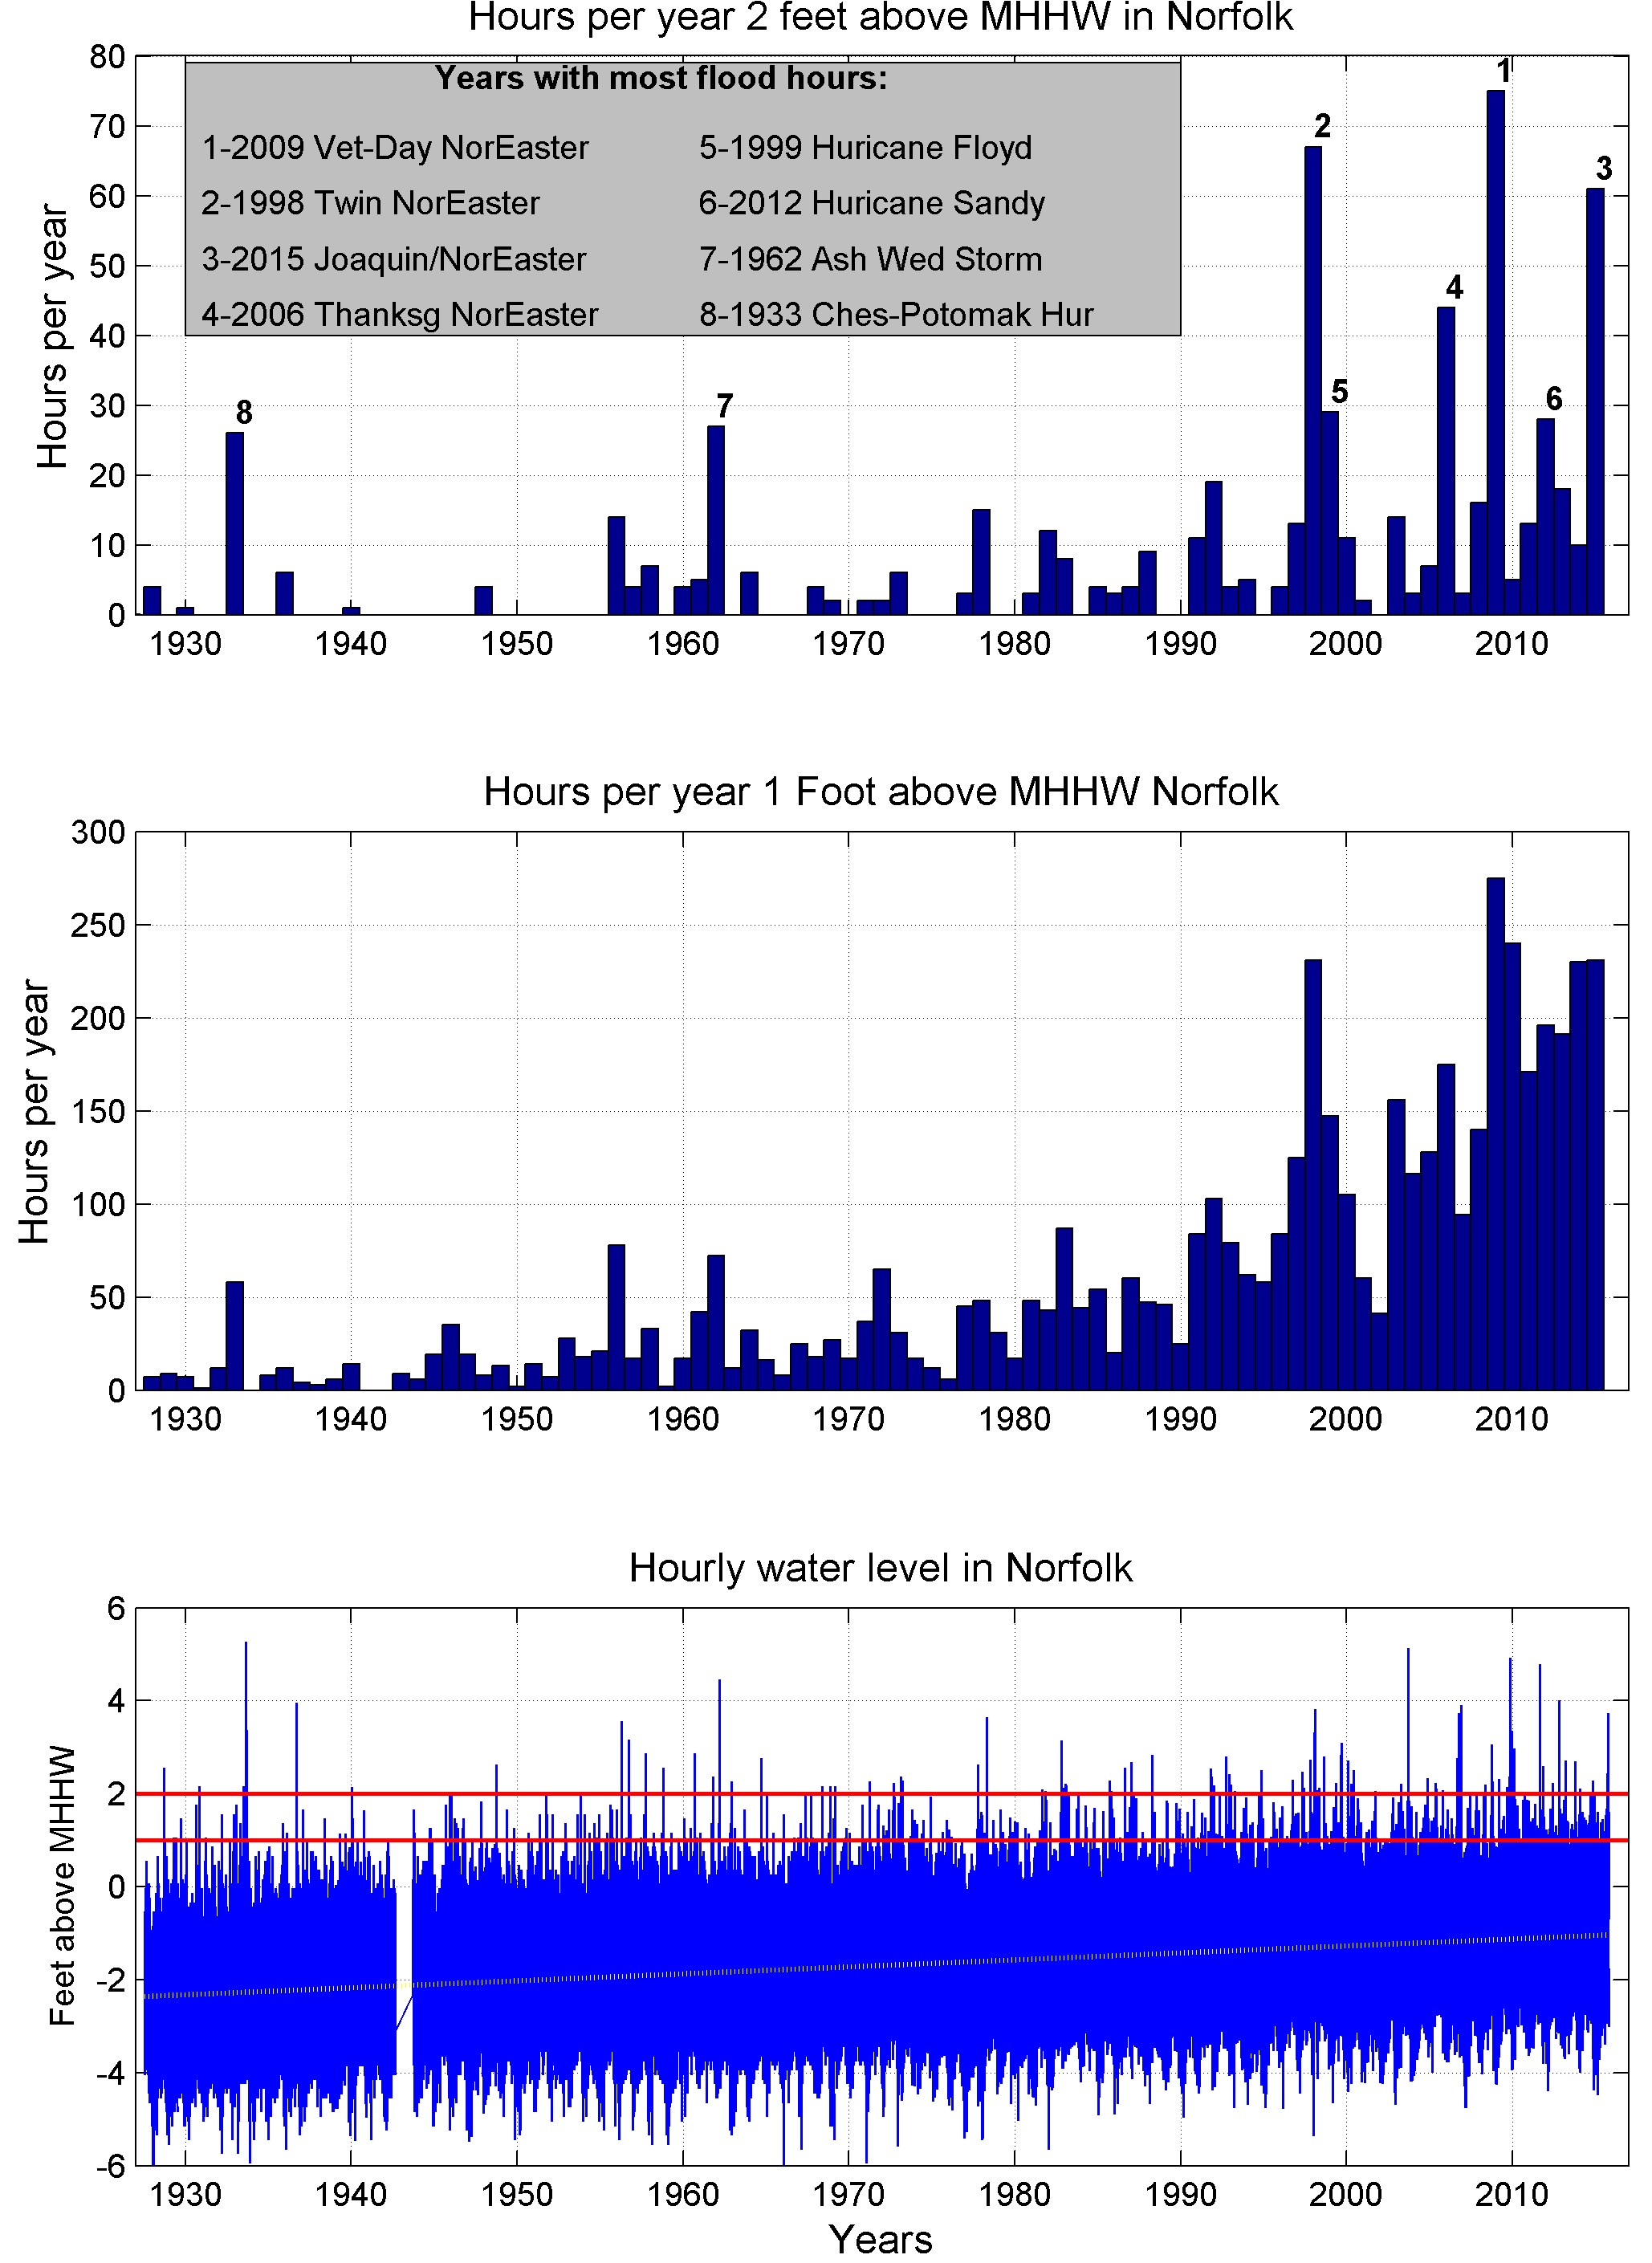
Figure 1.
Lower panel – hourly water level at Sewells Point, Norfolk, VA (NOAA COOPS site 8638610) since 1927. Linear trend shown a simple linear regression. Lower red iine is 1 foot above the current MHHW datum. The upper red line is 2 feet above. It is quite clear that there are more events above the red lines in recent decades.
Middle Panel – Hours that water level is 1 foot or more above MHHW. Figure 2 shows an example of flooding under those conditions.
Upper Panel – Hours that water level is 2 feet or more above MHHW. Figure 3 shows an example of flooding under those conditions.
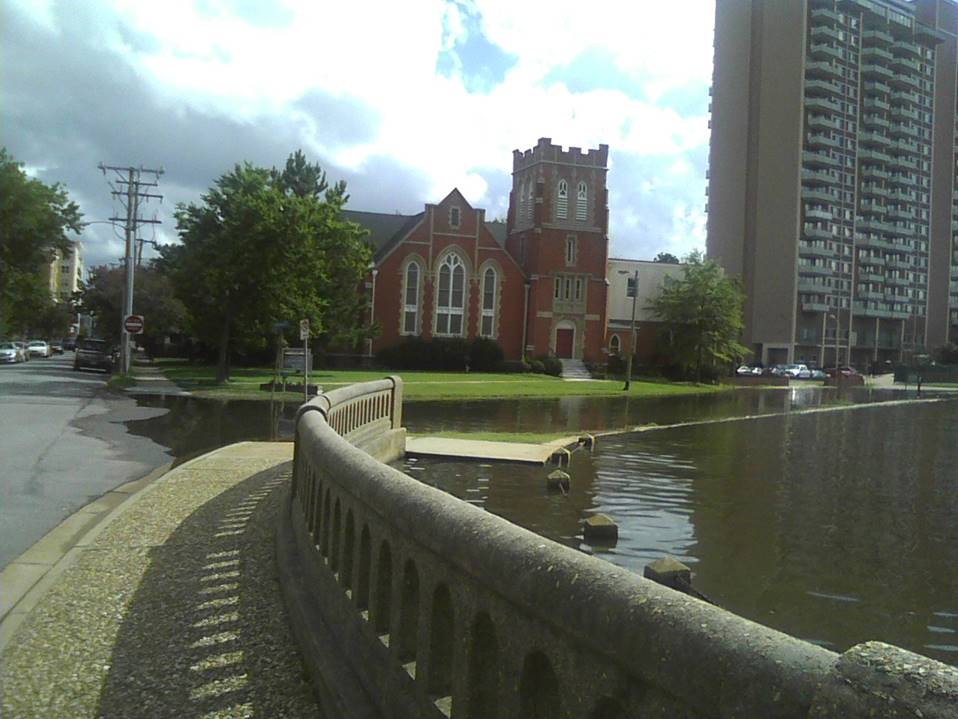
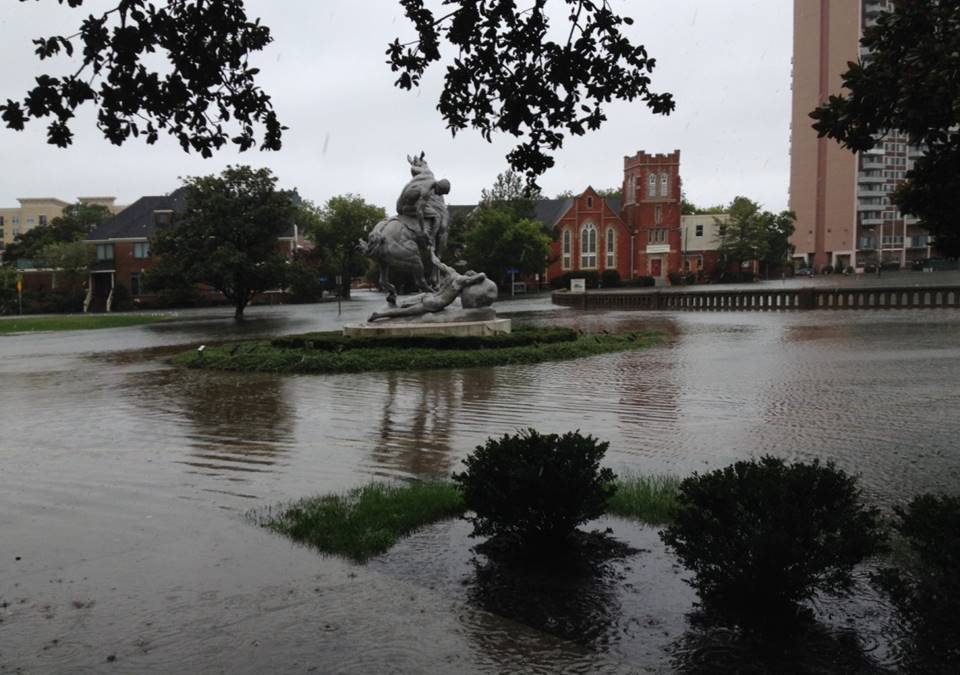
Figure 2 and 3. The two images show the effect of 1 and 2 feet above MHHW in a neighborhood in downtown Norfolk, Virginia. This is called nuisance flooding which I will describe in a coming blog.
Figure and images provided by Dr. Tal Ezer (Old Dominion University)
No comments:
Post a Comment